Last updated on February 11th, 2022 , 11:35 am
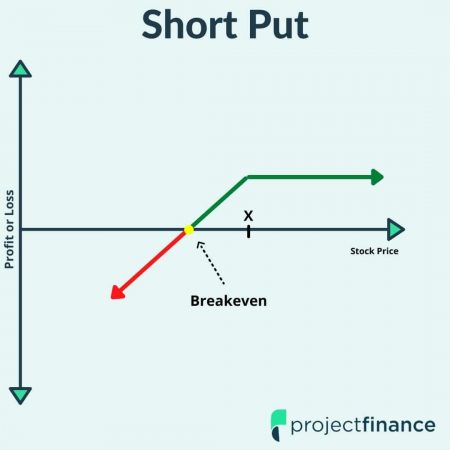
The above graph represents the profit/loss of a short put option at expiration, where X represents the strike price of the put sold.
Table of Contents
Short Put Option Definition
Selling (writing) put options is a neutral to bullish options trading strategy with potentially great risk. Since short-put sellers are the counterparty to long-put buyers, traders utilizing this strategy incur the obligation to purchase the underlying security at the strike price specified should the long party exercise their long put option.
Short Put Option Inputs
● Short Put Option at Strike Price X
Short Put Option Profile
Maximum Profit: Put Sale Price (Credit Received) x 100
Maximum Loss: (Put Strike Price – Credit Received) x 100
Breakeven Price: Put Strike – Credit received
Probability of Profit: Between 50-99% Depending on Strike of Put Sold
Assignment Risk: Increases with Falling Extrinsic Value
In an environment where interest rates are hovering near 0%, investors are seeking alternative ways to generate income.
Many investors are turning to selling put options for income. This market-neutral/bullish options strategy is more popular than ever amongst income-thirsty investors.
Why? The majority of the time, selling put options is a great way to generate steady income. However, this relative stability of income comes not without great risks.
Highlights
When you sell a put option “naked”, the most you will ever make is the premium received; maximum loss can be enormous, occurring only rarely when the underlying falls to $0 in value
Options premiums increase with time and implied volatility
A short put option that is out-of-the-money at expiration will expire worthless and the full premium will be collected
Traders have three choices when their put option is near or at-the-money as expiration nears; close the put in the market, be assigned and purchase the stock, or “roll” the trade via a calendar or diagonal spread
In order to understand the short put options trading strategy, we must first understand the mechanics of long puts.
Long Put Option Explained
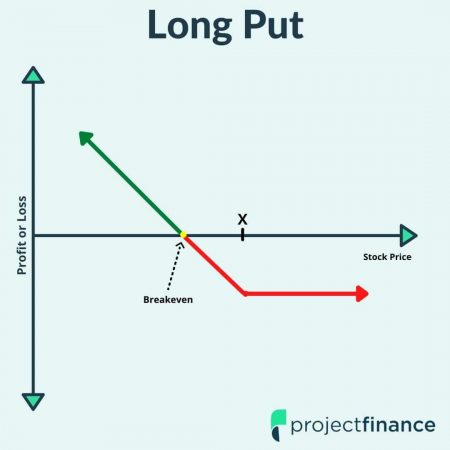
Traders who buy put options are typically extremely bearish on an underlying stock/security. Let’s take a look at the textbook definition of a long put, then jump right into an example.
Long Put Option Definition: A long put option is a derivative that gives the owner the right, but not the obligation, to sell a certain amount of a security (stock) at a specified price (strike price) by a specific date (expiration date).
Long Put Option Example
Let’s assume we are extremely bearish on AAPL with the stock trading at $151. We are quite confident the price will fall dramatically in the time leading up to, and following, the company reporting earnings in the weeks ahead.
After scanning the options chain for puts, we decide to purchase a 145 s put on AAPL expiring in 39 days. Below, you will find the details of our trade.
AAPL Long Put Contract
Initial AAPL Stock Price: $151
Put Strike Price: 145
Expiration: 37 Days Away
Put Purchase Price: $2
Put Breakeven Stock Price: 145 Strike – $2 Debit = $143
Maximum Profit Potential: $143 ($14,300)
Maximum Potential Loss: $2 ($200)
In the above example, we purchased an out-of-the-money put at the strike price of 145 for a debit of $2. Whenever you purchase an option (or anything!) the most you will ever lose is the purchase price paid. Therefore, when we buy this option, we can only ever lose $2 (or $200 taking into account the multiplier effect of 100).
Under what circumstance do we lose the entire premium paid? If the stock price closes above our strike price at expiration. Put options give the holder the right (but not obligation) to sell stock at the strike price. Why on earth would anyone want to sell stock at the strike price if the market stock price is more favorable? They wouldn’t.
How much can we make on this trade? Our best-case scenario will happen if AAPL is trading at zero by expiration (unlikely!). We paid $2 for a put option at the 145 strike price. To determine our maximum profit, just subtract the debit paid from the strike price (145-2) and that will give us a maximum potential profit of $143 ($14,300). This will occur with AAPL trading at zero on expiration in 39 days; again, unlikely.

New to options trading? Learn the essential concepts of options trading with our FREE 160+ page Options Trading for Beginners PDF.
Short Put Option Introduction
Options are incredibly versatile investment vehicles. You can combine calls and puts in innumerable ways. In addition to buying options, you can also sell options.
Many professional traders exclusively sell options. Selling options naked, however, introduces traders to potentially devastating risks. Let’s return to our above AAPL trade, but this time let’s sell the put option instead of buying it. Here are our trade details:
AAPL Short Put Contract
Initial AAPL Stock Price: $151
Put Strike Price: 145
Expiration: 37 Days Away
Put Sale Price: $2
Put Breakeven Stock Price: 145 Strike – $2 Premium= $143
Maximum Profit Potential: $2 ($200)
Maximum Potential Loss: $143 ($14,300)
We are going to focus on two components in the above table: maximum profit and maximum loss.
Maximum Profit in Short Puts
In our previous long put example, our maximum profit was $143 ($14,300). In the short put example above, our profit is only $2 ($200). Why is this? When you sell an option, the most you can ever make is the premium received.
Long put options are profitable only in bearish markets. Short put options, however, are profitable in neutral, bullish and even minorly bearish markets. In theory, this strategy should be profitable the majority of the time.
When you sell a put option, probability is on your side. Of course, you give something up for your high odds of success. This comes in the form of risk.
Maximum Loss in Short Puts
When you sell a put optoin, your maximum loss occurs when the stock is trading at zero on expiration. For our trade, we would incur a loss of $143 ($14,300) if AAPL were to fall to zero by expiration. That’s a lot of money!
We are risking over 14k to make a lousy $200. Is that a trade you’d like to make?
Probably not. So why do so many investors sell put options for income?
Because chances are, the stock price will not be zero when our option expires. Chances are, AAPL will be trading above $145, resulting in a maximum profit to us.
So what, exactly, are the odds our trade has of achieving maximum profit? The Greek “delta” tells us. Let’s take a look at how delta interacts with different strike prices next.
Short Put Options: Choosing a Strike Price
Traders who sell put options for income generally sell strike prices that are considerably out-of-the-money. Why? The further out-of-the-money a put option is, the greater the odds that option will have of expiring worthless.
But can we determine what these odds are by a method other than guessing? Yes!
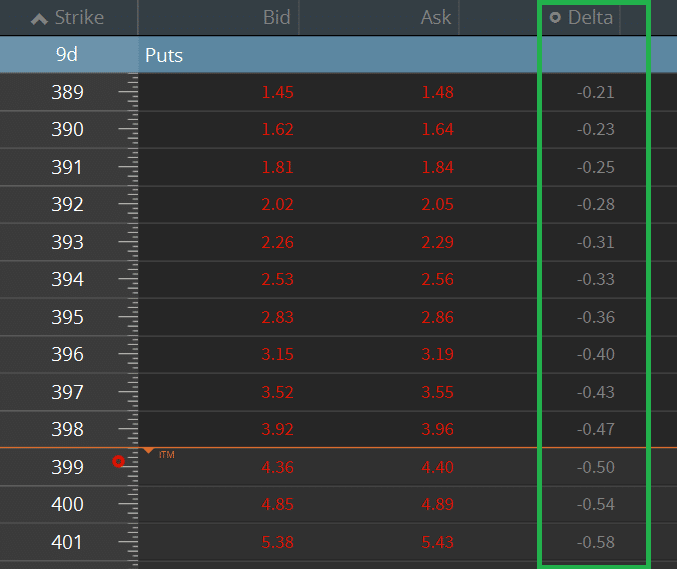
Take a look at the below put options chain for Invesco QQQ Trust (QQQ) on the tastyworks trading platform.
We are interested in the column titled “Delta” in green. Delta is one of the option Greeks. This Greek can be useful in many ways, including telling us the odds that an option has of expiring in the money.
Delta and In-The-Money Odds
QQQ is currently trading at $399/share. The put options in the above table expire in 9 days.
Take a look at the 399 put. Its delta is -0.50. This tells us the 399 at-the-money option has a 50% chance of expiring in-the-money. This should make sense; since the stock is trading at this same price, there should be a 50/50 chance that AAPL will either be above or below this level at expiration.
Let’s look at the 390 put now. In order for this option to be in-the-money, the stock needs to fall by $9 by expiration, which is 9 days away.
What are the odds this happens?
Just look at the delta, which is -0.23 for the 390 put. This option, therefore, has a 23% chance of expiring in-the-money on expiration. In other words, if you sell this put option, you have a 77% chance (100-23 delta) of the option expiring worthless and achieving maximum profit.
77% chance of success sounds pretty good. However, take note of how the premium dwindles the further out-of-the-money you go. If you recall the massive maximum loss potential on short puts, this low premium does not make for a very nice risk/reward profile.
Short Put Options and Time Value
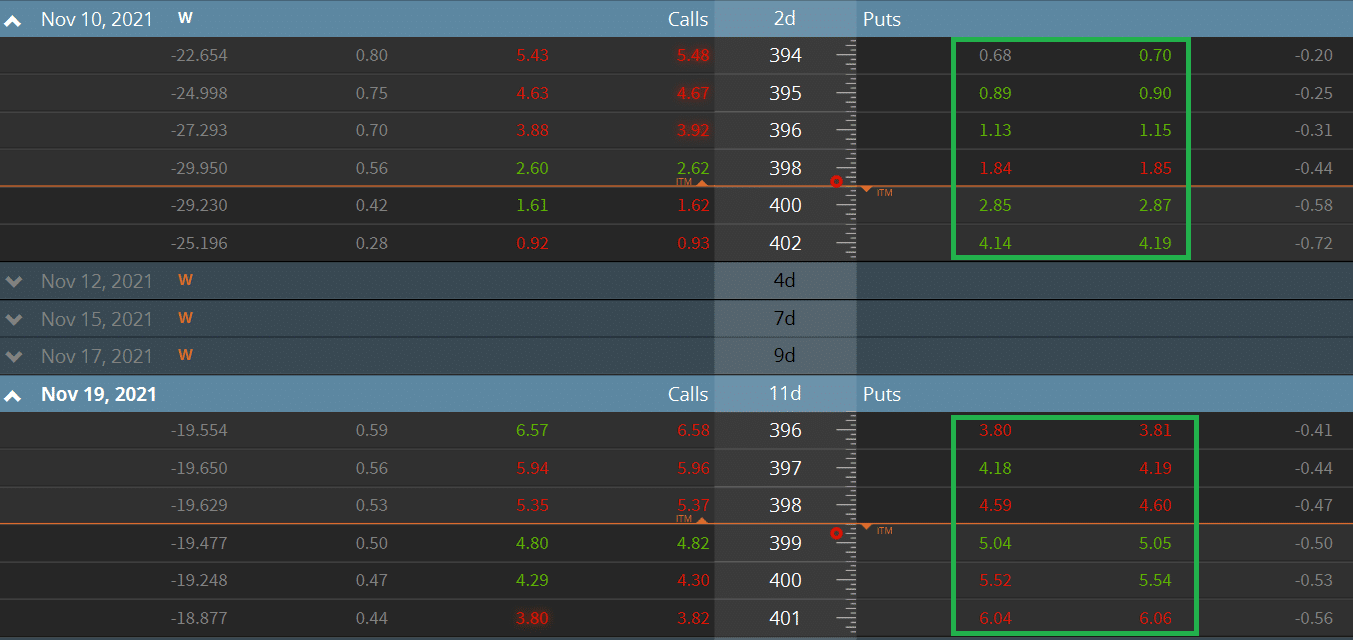
The time-to-expiration will affect how much premium you can collect from selling a put option. The greater the time to expiration, the greater premium you will receive. Take a look at the below two options chains on the QQQ’s from the tastyworks trading platform.
QQQ Put Options and Days to Expiration
The options in the green square on top expire in 2 days; the options in the lower green square expire in 11 days.
Compare the pricing on the 396 puts expiring in 2 days to the 396 puts expiring in 11 days. The options with 2 days left are trading at $1,14, while the options with 11 days left are trading at $3.80.
Additionally, you can see the delta (or the odds of expiring in-the-money) increases for options with more days to expiration.
Why is this? The underlying has more time to approach the strike price level. A lot of options trading can be understood without using math at all; instead of understanding rules, just think intuitively about a scenario, and it should make sense.
Short Put Options and Market Volatility
High implied volatility is synonymous with high options premiums.
Broad market volatility can be gauged by looking at the VIX index. The VIX index measures the market’s expectations for volatility over the proceeding 30 days based on near-term S&P 500 index options. The higher the level of the VIX, the higher the premiums for options will be.
Traders looking to sell put options for income could receive a greater premium if they sell during times of elevated volatility. However, this comes with greater risks too – in volatile times, the underlying has a greater chance of plummeting and breaching the strike price of put options sold.
Take a look at the below 5-year chart, which compares SPY (an S&P 500 tracking ETF) to the VIX. When the blue line is at its zenith, options premiums are very elevated. Notice how this coincides with large downturns in the SPX.
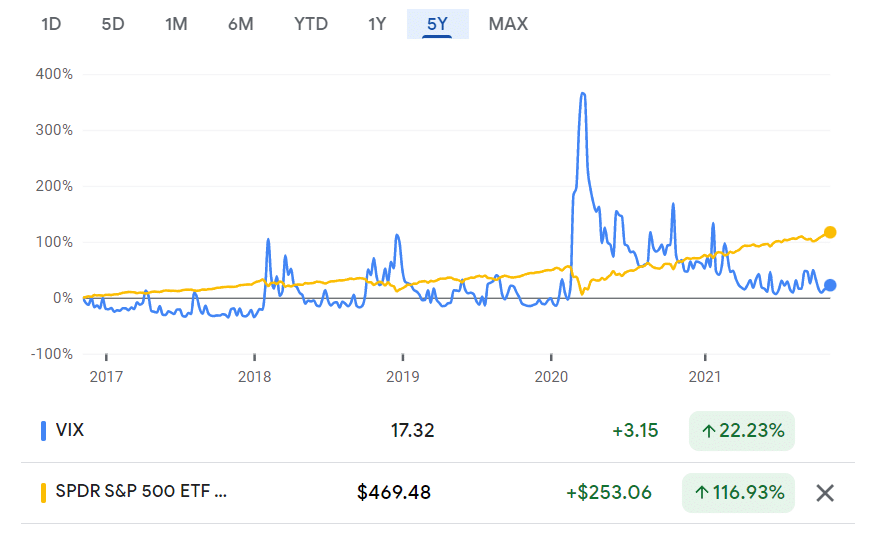
Chart from Google Finance
Short Put Options and Stock Volatility
The levels of implied volatility on individual stocks can vary widely.
Two stock trading at the same exact price can yield vastly different option premiums (and risks) for similar strike prices. Check out the below options chains from tastyworks, comparing two stocks currently trading at the same exact price.
The underlying stock prices for the above two options chains (BILL and LMT) are both trading at $342/share.
Why, then, are the premiums so vastly different?
Comparing Implied Volatility in Options
The 340 put option for BILL is trading around $12, while the 340 put option for LMT is trading at $4, about a third of the price. The underlying stock, however, is trading at the same exact price for both. Additionally, the time to expiration (10 days) is also the same. Why such a huge difference in premium?
We’ll find our answer in the upper right-hand corner of the options chains, where I have circled the “Implied Volatility” (IV) in green.
IV measures the expected volatility of an underlying security over the life of an option. For the November 19 options above, the IV for BILL is 64.6% while the IV for LMT is only 7.59%.
The greater the IV, the higher the premiums (and risks!) options will have. History tells us that the stock of BILL undulates more wildly than that of LMT, therefore the pricing of BILL’s options must be elevated to reflect the stock’s future potential moves.
Selling Put Options and The Greeks
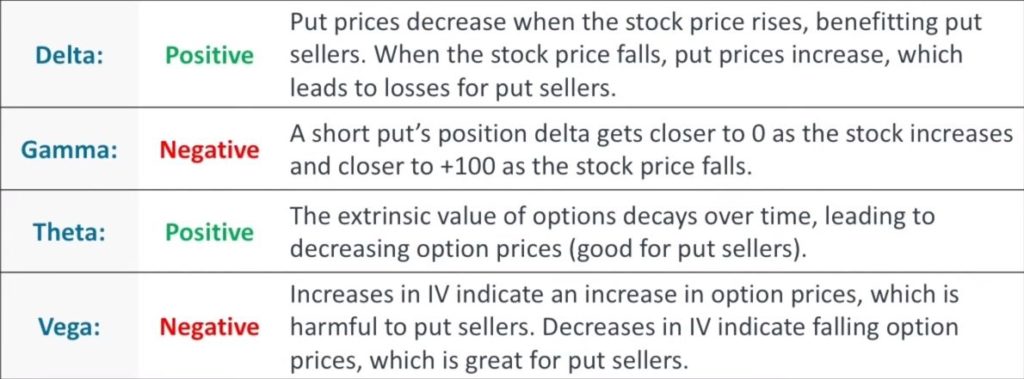
We touched upon the Greek “delta” earlier. However, if you want to be a pro options trader, having all of the Greeks in your toolbox is a must. Below, we have provided a cheat sheet that shows the relationship between short put options and the Greeks.
Short Puts & The Greeks
If you’d like to learn more about the Greeks, read our article, “Option Greeks Explained: Delta, Gamma, Theta & Vega.”
Historical Performance of Selling Put Options
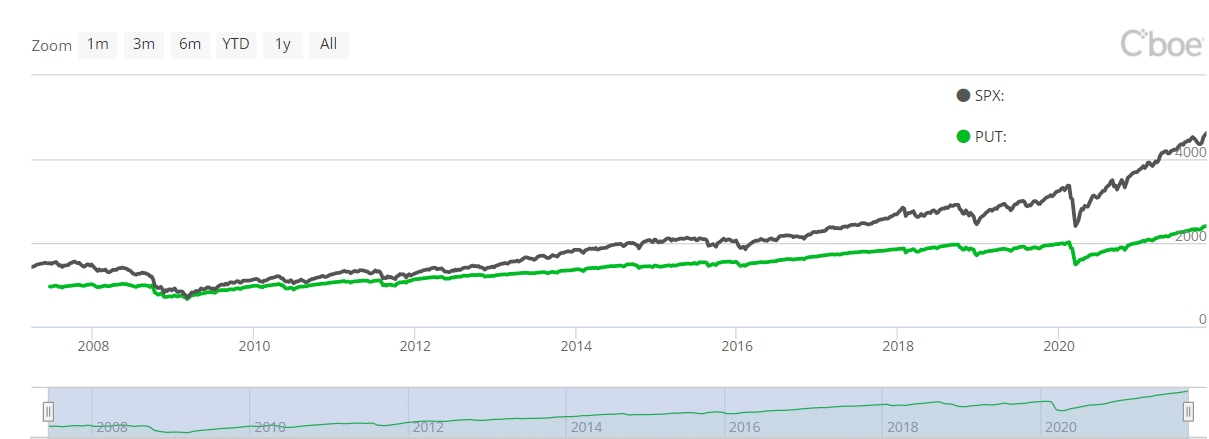
The best resource we have for the long-run profitability of selling put options comes from The Cboe S&P 500 PutWrite Index, PUT.
"The PUT portfolio is composed of one- and three-month Treasury bills and of a short position in at-the-money put options on the S&P 500 index (SPX puts). The number of puts sold is selected to ensure that the value of the portfolio does not become negative when the portfolio is rebalanced."
CBOE Website
The PUT index tracks the performance of at-the-money puts, not out-of-the-money puts, which are the favorite amongst traders looking to generate income.
Short at-the-money puts have greater premiums than out-of-the-money puts. They also have a lower chance of expiring worthless.
With that being said, the index does give us a ballpark idea of the long-term performance of selling put options against an index (SPX).
The below chart compares the historical dollar comparison performance of PUT (green) to SPX (black).
Since its inception in 2007, the PUT index has vastly underperformed the SPX index.
Closing Short Put Options
If all goes as planned, your short put option will expire worthless, and you’ll collect the full premium from the trade.
But sometimes, the market moves against us. If you are short a put option and the underlying is close to or has already breached your strike price at or near expiration, you have one of three options:
1.) Let the option be assigned and purchase the stock.
Some traders that sell put options for income do so with the intent to purchase the stock should it breach the level of the put sold. Purchasing stock, however, can be quite costly, so it is advised that traders have the capital required to hold the underlying shares in these scenarios, or else your broker will liquidate the position.
2.) Close the put in the open market.
If you want to throw in the towel on your trade, the best option is to simply buy back your short put in the market.
3.) Roll your put option.
If you want to remain in the position, you can always “roll” your short put from one expiration cycle to another. This can be accomplished in a single trade. Your options are a “calendar spread” or a “diagonal spread”.
- Calendar Spread: In a calendar spread, you will simply roll the same strike price from one expiration to another
- Diagonal Spread: Sometimes, traders want to sell a put option that is further out-of-the-money when their short is breached. A diagonal spread can accomplish this. This strategy consists of buying and selling options of the same type, but opposing strikes and expirations.
Final Word
Selling put options naked is a risky business. The odds are in your favor for this income generation strategy, but when the market moves against you, watch out.
In my days as an options broker, I have seen years of profits from selling puts wiped out in a single day. It is because of this many traders refer to selling options naked as “picking up pennies in front of a steam roller”.
Be careful out there, traders!
