Last updated on April 5th, 2022 , 06:29 am
Jump To
The straddle is a vital trading strategy that all options traders must have in their toolbox. Even if you never place a straddle, the information this strategy relays to us is of utmost importance.
In this article, projectfinance will be reviewing both the long and short straddle options strategy. We will also examine how this strategy, regardless of whether or not you actually trade it, can give us a pretty good idea as to the future movement of a stock, ETF, index, or any security, for that matter.
Let’s start by looking at the long straddle.
TAKEAWAYS
- A straddle consists of both a call and put option on the same security, strike price, and expiration date.
- In a long straddle, both the call and put options are purchased
- In a short straddle, both the call and put options are sold
- Long straddles benefit from either large upside or downside movements in a stock
- Short straddles benefit in flat, or sideways markets
- At-the-money straddles on near-term options help traders to forecast a stock’s expected move
Long Straddle Explained
Long Straddle Definition: In options trading, a “Long Straddle” position is established when both a call and a put contract are purchased on the same strike price and expiration date for a security.
In options trading, you can both buy and sell all strategies. When your trade results in a net debit (meaning it costs you money) the cost of this trade will be debited from your account.
Long Straddle Components
- Long Put X
- Long Call Y
- On the same security
- Of the same strike price
- Of the same expiration date
When all of these conditions are met, you will have a long straddle.
Since we are a net purchaser of options here, we expect the underlying stock to move. But in what direction? That’s the beauty of a straddle: since we are long both a call and put, if the stock moves up OR down, by a lot, we will make money.
But under what conditions will we make money? How far does the stock have to move? Where do we break even?
Let’s first take a look at at the profit/loss profile of this trade, then an example.
Long Straddle Profile
Long Straddle Maximum Profit:
Unlimited, no cap on the call
Long Straddle Maximum Loss:
Total debit paid
Long Straddle Break Even:
Upside: Long call strike Y (plus) total premium paid
Downside: Long put strike X (minus) total premium received
New to options trading? Learn the essential concepts of options trading with our FREE 160+ page Options Trading for Beginners PDF.
Long Straddle Example Trade
To begin, we must first choose the strike price of the call and put that we will be buying. For straddles, this strike price is almost always close to or at-the-money.
Take a look at the below sample options chain.

- Current Stock Price=> $250
- Long Put=> 250 Put for $15.10
- Long Call:=> 250 Call for $15.20
- Net Debit=> $30.30
We said before that most long straddles use at-the-money options. Since the stock is trading at $250 here, we have purchased both the at-the-money 250 call and 250 put for a net debit of $30.30.
Buying at-the-money options allows us to profit from equal upside and downside stock moves. If you purchased that straddle at the $275 strike price, you would be much more bullish and the profile/loss profile would be skewed.
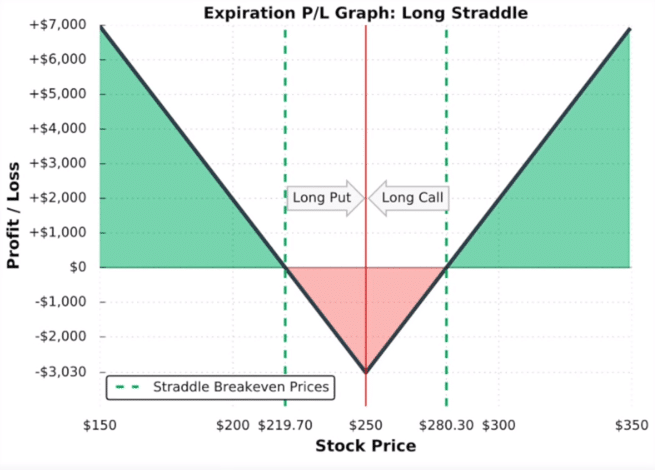
Let’s take a look at a visual of this at-the-money straddle, then break down its profit/loss profile.
Long Straddle Maximum Profit
In theory, the maximum profit is unlimited on straddles. This is because of the long call. Since there is no cap on how high a stock can go, the value of a call can theoretically go to infinity.
Long Straddle Maximum Loss
Whenever you purchase options, the most you can ever lose is the premium paid. Since we paid $30.30 for this straddle, our maximum loss would be $3,030 (taking into account the options multiplier effect of 100).
When would this happen? If the stock closes at $250 exactly on the expiration day. Under this scenario, both our long call and long put would be (just about) worthless.
Long Straddle Break Even
Since we are long two options, we have two breakevens.
- Call Break Even: 250 + 30.30 = $280.30
- Put Break Even: 250 – 30.30 + $219.70
In order to determine the break even here, we must start by looking at our total debit paid. On expiration day, one of these options must have enough value to gain us $30.30, our net debit paid.
That’s a pretty big move! And if that happens, we will only break even. In order to make money, the stock price needs to move more than $30.30 in either direction.
Therefore, you should only purchase a straddle when you believe the underlying price will move by a substantial amount. If you were confident in the future direction of a stock’s movement, you wouldn’t buy a straddle, but simply a call or put.
Let’s now take a look at the short straddle, which is simply the exact opposite of what we just learned.
Short Straddle Explained
Short Straddle Definition: In options trading, a “Short Straddle” position is established when both a call and a put contract are sold on the same strike price and expiration date for a security.
Since we are net sellers of options here, we will be receiving a credit for this trade. Therefore, this trade will result in a credit of cash to our account.
We learned before that the long straddle profits when the stock moves a lot. Short straddles are the exact opposite; these strategies profit when the underlying stock moves very little.
Therefore, this strategy is best for more market-neutral traders.
Short Straddle Components
Just as with the long straddle, the short straddles must be composed of options that are:
- On the same security
- Of the same strike price
- Of the same expiration date
Let’s take a look at this strategy’s profit/loss profile, then move on to an example.
Short Straddle Profile
Short Straddle Maximum Profit:
Total credit received
Short Straddle Maximum Loss:
Unlimited, there is no cap on how high the short call can go
Short Straddle Break Even:
Downside: Short put strike X (minus) total premium received
Upside: Short call strike Y (plus) total premium received
Short Straddle Example Trade
Just as with the long version of this trade, we are going to placing the short version with at-the-money options (the 250 strike price from the below options chain).

- Current Stock Price => $250
- Short Put=> 250 Put for $15.10
- Short Call=> 250 Call for $15.20
- Net Credit=> $30.30
So we have sold both an at-the-money call and put option here. Under what circumstances would a trader place this trade? When they believe the underlying is not going to move.
Generally, straddles are sold when a trader believes the options premium (due to implied volatility) is too high. The volatility of options (particularly short-term options) is usually elevated before major market events, such as earnings reports and unemployment numbers.
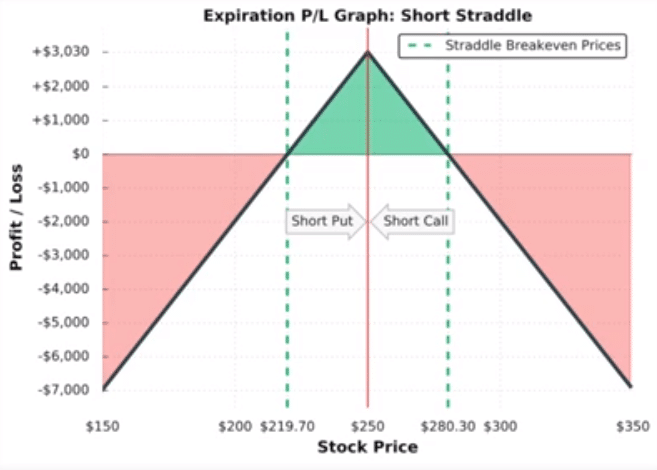
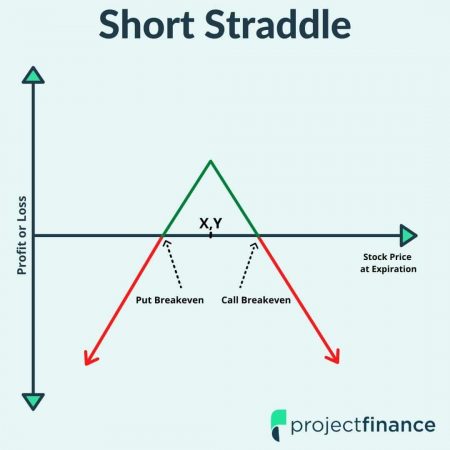
Next, let’s take a look at a visual of this trade, as well as the circumstances under which we will make money, lose money, and break even.
Short Straddle Chart
Short Straddle Maximum Profit
Whenever you are a net seller of options, your maximum profit is always the credit that you take in.
For this trade, we took in a credit of $30.30. Therefore, when accounting for the multiplier effect, our maximum profit is $3,030.
Short Straddle Maximum Loss
When we went over the long straddle, we said that (because of the call) maximum profit was unlimited. Guess what the maximum loss is for the short straddle? Bingo. Unlimited. That short call can, in theory, go to infinity.
It is because of this great risk that brokers usually require a substantial margin to hold these trades.
Short Straddle Break Even
Again, since we have two options, we have to break evens:
- Call Break Even: 250 + 30.30 = $280.30
- Put Break Even: 250 – 30.30 + $219.70
Our net credit for this trade was $30.30. Therefore, either of our short options must be trading at this value on expiration for us to break even. This occurs in either of the above two listed scenarios.
Short Straddle: The Expected Move
The straddle (whether actually traded or not) is an invaluable asset to traders. Why? It can do a pretty darn good job of predicting future stock price movements.
Let’s take a look at a TSLA options chain on the tastyworks trading platform.
TSLA Options Expiring in One Day: Stock at $2,965
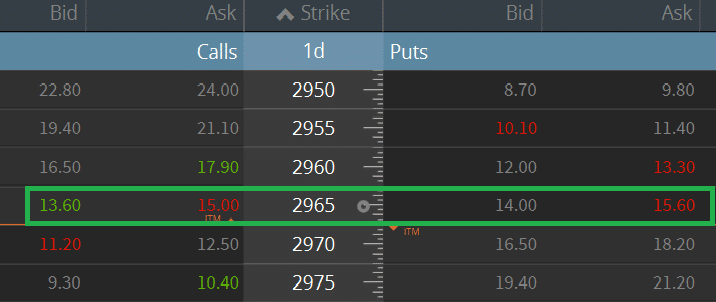
The above options expire in one day. Let’s assume that Tesla will release earnings tomorrow morning. The stock is currently trading at $2,965.
By adding together the combined premiums of both the at-the-money 2965 calls and 2965 puts, we can get a ball park range of how much TSLA will move post earnings.
In this instance, the stock is expected to move by about $30 ($15 + $15).
Using straddles to predict future price movement is a great window into the (potential) future of a stock. If you’d like to learn more about the expected move, check out this article by MarketWatch, which tells of calming volatility in GameStop.
Note: Curious how the straddle compares to the strangle? Check out our article here! Straddles vs Strangles.

New to options trading? Learn the essential concepts of options trading with our FREE 160+ page Options Trading for Beginners PDF.
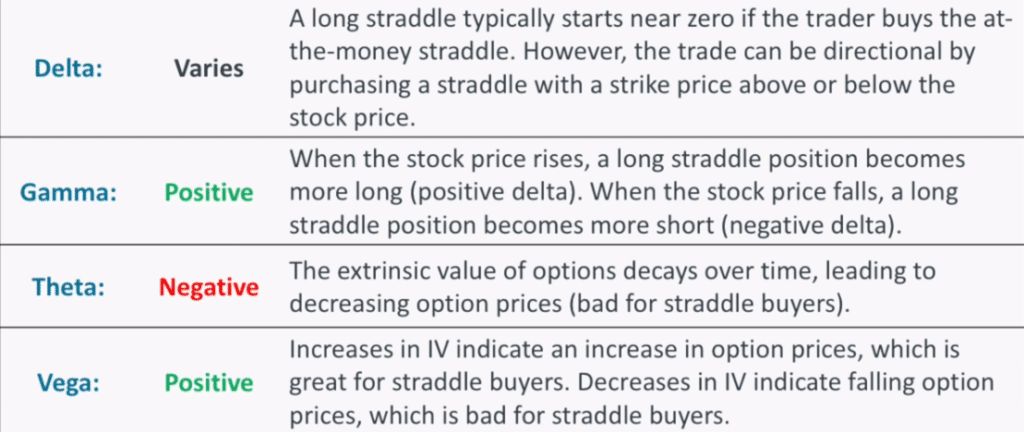
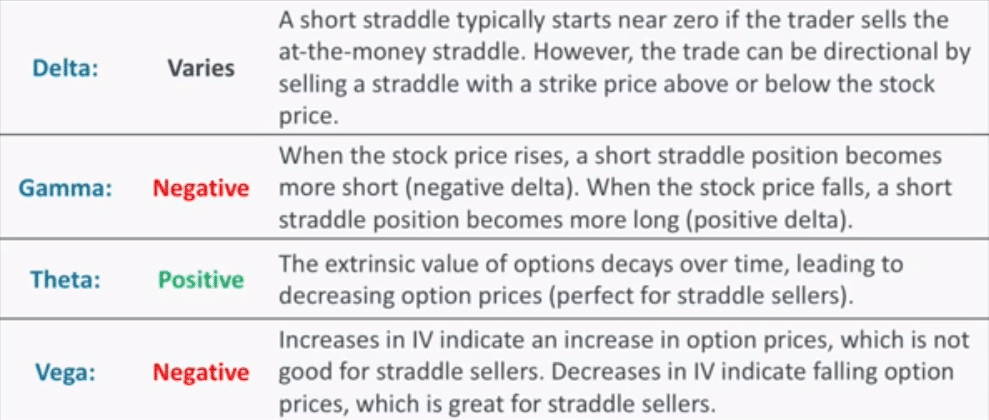
Straddles and The Greeks
Let’s conclude our article by studying how the straddle interacts with the option Greeks.
