Last updated on February 10th, 2022 , 12:46 pm
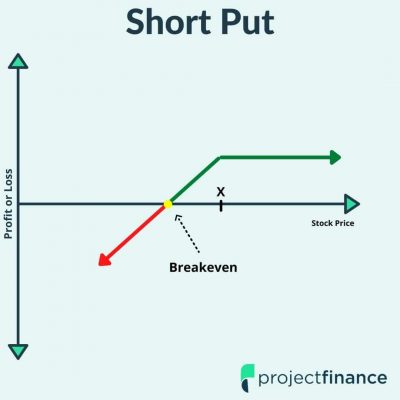
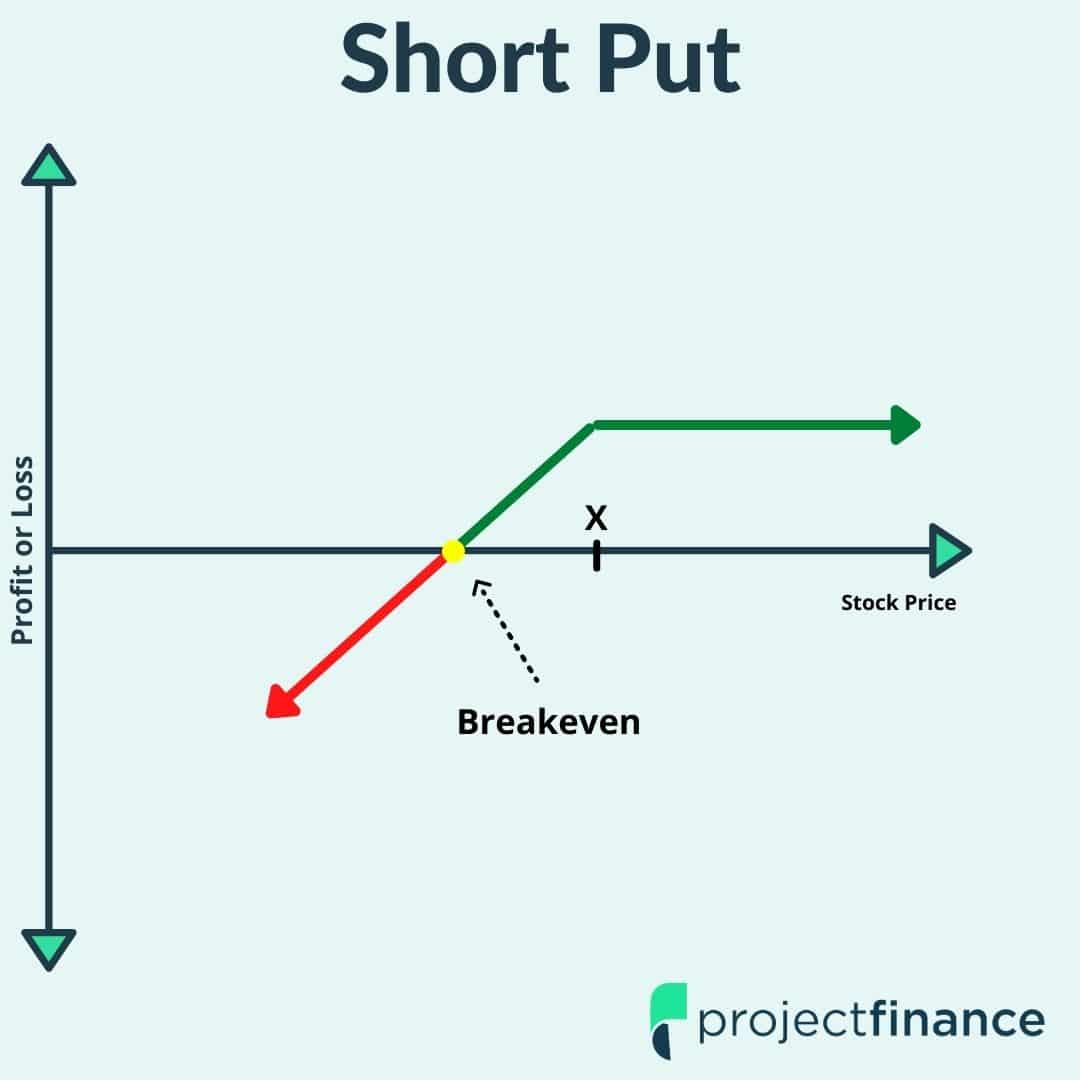
The short put option strategy is popular among optimistic investors and traders who have a bullish outlook for a stock but don’t mind buying shares if the stock price falls.
In this post, we’ll examine over 10 years of 16-delta short put management data from 41,600 trades in the S&P 500 ETF (SPY).
More specifically, we’ll answer the following questions:
1. Which strategies were the most profitable?
2. Which strategies were the least profitable?
3. How did implied volatility at the time of entering the trade impact the overall profitability?
Stick around!
I guarantee you will learn something valuable that you can start incorporating in your trading today.
Study Methodology
Underlying: S&P 500 ETF (SPY).
Time Frame: January 2007 to May 2017 (most recent standard expiration, as of this writing).
Entry Dates: Every Trading Day.
Expiration Cycle: Standard Expiration Closest to 45 Days to Expiration (resulted in trades between 30-60 days to expiration).
Trade: Sell the 16-Delta Put Option
Number of Contracts: 1
Short Put Trade Management
For each entry, we tested 16 different management combinations:
Profit or Expiration: 25% Profit, 50% Profit, 75% Profit, OR Expiration.
Profit or -100% Loss: 25% Profit, 50% Profit, 75% Profit, OR -100% Loss.
Profit or -200% Loss: 25% Profit, 50% Profit, 75% Profit, OR -200% Loss.
Profit or -300% Loss: 25% Profit, 50% Profit, 75% Profit, OR -300% Loss.
Management Example: 50% Profit or -200% Loss
To demonstrate how we calculated the profit and loss levels, let’s run through a quick example using a 50% profit OR -200% loss target.
Entry Credit: $1.00
Profit Target: $0.50 ($1.00 Entry Credit – $1.00 x 50%)
Loss Limit: $2.00 ($1.00 Entry Credit x 200%). A $2.00 loss would occur when the put option traded $3.00 ($1.00 Entry Credit + $2.00 Loss).
Metrics We’ll Analyze
Before we get started, I want to quickly cover the primary metrics we’ll analyze:
Win Rates: The percentage of trades that were profitable.
Win Rate – Breakeven Win Rate: The difference between the success rate and what the strategy required to break even (based on average profits and losses).
Average P/L: The average profitability of each trade. The average P/L figures will be consistent with the Win Rate – Breakeven Win Rate levels.
10th Percentile P/L: The P/L that 90% of trades exceeded (a probabilistic way of analyzing the worst drawdowns).
45-Day Adjusted P/L: Not all trades were held for the same amount of time. We standardized the average P/L of each trade to a 45-day period.
Win Rates: 16-Delta Short Puts
As expected, closing profitable trades early boosted the success rate, while taking losses reduced the success rate:
Before moving on, I want to clarify the x-axis labels on the charts.
As an example, “25% / Exp.” means the trades were closed for 25% of the maximum profit potential OR held to expiration.
“Exp. / -200%” means the trades were held to expiration OR closed for a -200% loss.
Win Rates – Breakeven Win Rates
One of the more interesting metrics we analyze is the win rate minus the breakeven win rate, or the win rate that’s required for the strategy to break even over time. The breakeven win rate is calculated using the average profit and average loss of all the trades.
In a coin-flipping contest, if you win $1 for each toss that lands on heads and lose $1 for each toss that lands on tails, you’d need a 50% win rate to break even over time.
However, if you’re somehow able to win 60% of the time, then your Win Rate – Breakeven Win Rate would be 10% (60% Success Rate – 50% Breakeven Win Rate), and you’d make money over time.
Let’s take a look at the Win Rate – Breakeven Win Rate statistics for the short put trades:
Right out of the gates, we can see that the quicker profit-taking management combinations had the lowest margin between the success rates and the breakeven success rates, even though they had the highest success rates.
What does this mean?
Well, the 25% Profit / Exp. combination had a 98% success rate overall, but with a 2.2% Win Rate – Breakeven Win Rate, the strategy required a 95.8% success rate just to break even over time (based on the average profit of winning trades and the average loss of losing trades).
As it relates to your trading, just know that if you take profits very quickly, you will need a higher success rate over time to break even (since profits are so small relative to potential losses). For some, that may be daunting, and therefore may be better suited with a larger profit management strategy.
Average P/L Per Trade
Which short put management strategies were the most profitable, on average?
Since 2007, doing nothing and simply holding short put positions (16-delta, 30-60 DTE) to expiration has resulted in the highest average P/L per trade.
Consistent with the Win Rate – Breakeven Win Rates, the smaller profit-taking approaches had the lowest average profitability, which makes sense because the profits are taken much quicker and do not absorb losing trades as easily.
These figures are telling by themselves, but we don’t have the whole story. Let’s take a look at the worst drawdowns of each approach.
10th Percentile P/L
If you recall, the 10th percentile P/L tells us the P/L level that 90% of trades exceeded. For example, if the 10th percentile P/L is -$1,000, then 90% of trades had a P/L better than a loss of $1,000.
Let’s take a look at these “worst-case” drawdowns for each approach:
While the “do nothing” approach to selling puts has historically yielded the highest average P/L per trade, the “worst-case” drawdowns were also substantial. So, before jumping straight into the strategy with the highest average P/L, consider the drawdowns of that particular strategy.
As expected, the loss-taking approaches had substantially lower drawdowns.
When considering the average P/L per trade and the 10th percentile P/L metrics together, the loss-taking approaches become considerably more attractive.
At this point, we’ve uncovered an astonishing amount of information related to S&P 500 put-selling strategies.
But we’re not done yet.
In the next section, we’ll analyze the average time in trades for each approach, and then adjust the average P/L per trade of each approach to a 45-day period.
Average Time in Trade
Let’s first start with the average time in each trade for all of the approaches:
As we’d expect, incorporating some type of profit or loss management results in fewer days in each trade, on average. How does the reduced time in each trade impact the hypothetical average P/L over similar time periods?
To answer this question, we’ll normalize the average P/L per trade of each approach to a 45-day period:
45-Day Adjusted Average P/L = Avg. P/L Per Trade x (45 / Avg. Days in Trade)
Of course, this isn’t a perfect formula, but it does help put context around the “average profitability” of each approach based on the number of trades that can “fit” into similar periods of time.
After normalizing each short put management approach’s expectancy to a 45-day period, we find that the smaller profit-taking approaches yield the highest P/L figures because trades are closed and redeployed much faster.
However, keep in mind that opening and closing trades more often will generate more commission costs.
Additionally, by closing a profitable short put and selling a new short put, the strike price will likely be higher and your delta (directional) exposure will be more positive. The result is more severe drawdown potential if the market corrects after the new trade is opened.
Short Put Performance by VIX Level
The analysis in this post would not be complete without some implied volatility filtering. In the case of the S&P 500, the implied volatility levels can be gauged by the VIX Index.
In this final section, we’ll analyze some of the metrics from above, but we’ll evenly divide all of the trades into four buckets based on the VIX level at the time of entering the trades:
1. VIX Below 14
2. VIX Between 14 and 17.5
3. VIX Between 17.5 and 23.5
4. VIX Above 23.5
These VIX levels were selected based on the 25th, 50th, and 75th percentile of VIX levels at the time of all trade entries. By using these percentiles, we evenly divide all trades into four separate buckets and avoid any one bucket having substantially more or less occurrences than the rest.
The next sections hold some of the most interesting takeaways from this entire post, so be sure you keep reading.
Short Put Win Rates by VIX Level
When analyzing the win rates of each approach based on the VIX at entry, there weren’t any screaming takeaways:
However, things start to get very interesting when we dive a bit deeper.
Win Rates – Breakeven Win Rates by VIX Level
When we look at the difference between success rates and what was required to break even (based on average profits and average losses), we see that the passive approaches had the most “edge” in the lower VIX environments:
In the higher VIX environments, the loss-taking approaches significantly outperformed the profit-or-expiration approaches. We’ll see this relationship carry over to the average P/L per trade.
Short Put Average P/L by VIX Level
Let’s take a look at the average P/L per trade based on the VIX levels at entry:
These results are fascinating, as they show that more passive approaches (taking larger profits and not taking any losses) performed the best in the lower VIX environments.
However, the approaches with higher profit targets that also included a loss-taking strategy performed the best in the highest VIX environments.
The results suggest that during more volatile market periods, it has been wise to let profitable trades run while aggressively closing losing trades.
10th Percentile P/L by VIX Level
To fully understand the previous results, let’s look at the worst-case drawdowns of each approach based on the VIX at entry:
By looking at the profit OR expiration approaches (no loss-taking), it’s clear to see that the largest drawdowns have historically occurred when selling puts in high VIX environments.
Conversely, the smallest drawdowns have occurred when selling puts in ultra-low VIX environments.
While this might not make sense initially, it’s important to consider the fact that the market is typically grinding higher during ultra-low VIX periods (with low levels of historical volatility), and experiencing much wilder swings/downturns during high VIX periods (high levels of historical volatility).
In the final section, we’ll quickly examine the 45-day adjusted P/L of each approach.
45-Day Adjusted Average P/L by VIX Level
When normalizing each approach’s average P/L per trade to a 45-day period, we get the following results:
45-Day Average P/L = Avg. P/L Per Trade x (45 / Avg. Days in Trade)
From this chart, we see that the high VIX entries have historically been the best for the approaches where profits were taken between 25-75% while also closing losing trades.
However, keep in mind that this is a straight-line extrapolation of the average P/L per trade expanded into a 45-day window, and does not reflect the actual performance of closing profitable trades and redeploying into a new short put position.
Checklist
While we’ve covered a ton of data in this post, here are the most important findings:
✓ By closing profitable trades early, more positions can be traded in similar periods of time, which means the average profitability of short put strategies can increase substantially.
✓ In low VIX environments, short put drawdowns have historically been substantially lower compared to selling puts in high VIX environments.
✓ When selling puts in high VIX environments, implementing a loss-taking strategy has historically improved the average P/L per trade while also reducing the worst drawdowns by a substantial margin (compared to a passive management approach in high VIX environments).

