Last updated on February 10th, 2022 , 07:35 pm

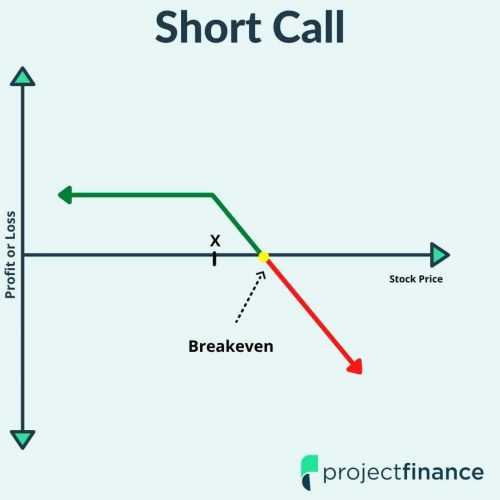
The short call option strategy is used by bearish traders with a high risk tolerance, as the strategy has unlimited loss potential (in theory).
In this post, we’ll examine over 10 years of 16-delta short call management data from 41,600 trades in the S&P 500 ETF (SPY).
More specifically, we’ll answer the following questions:
1. Which short call management strategies were the most profitable?
2. Which short call strategies were the least profitable?
3. How did implied volatility at the time of entering the trade impact the overall profitability?
Jump To

New to options trading? Learn the essential concepts of options trading with our FREE 160+ page Options Trading for Beginners PDF.
Study Methodology
Underlying: S&P 500 ETF (SPY).
Time Frame: January 2007 to May 2017 (most recent standard expiration, as of this writing).
Entry Dates: Every trading day.
Expiration Cycle: Standard expiration closest to 45 days to expiration (resulted in trades between 30-60 days to expiration).
Trade: Sell the 16-Delta call option
Number of Contracts: 1
Short Call Trade Management
For each entry, we tested 16 different management combinations:
Profit or Expiration: 25% Profit, 50% Profit, 75% Profit, OR Expiration.
Profit or -100% Loss: 25% Profit, 50% Profit, 75% Profit, OR -100% Loss.
Profit or -200% Loss: 25% Profit, 50% Profit, 75% Profit, OR -200% Loss.
Profit or -300% Loss: 25% Profit, 50% Profit, 75% Profit, OR -300% Loss.
Management Example: 50% Profit or -200% Loss
To demonstrate how we calculated the profit and loss levels, let’s run through a quick example using a 50% profit OR -200% loss target.
Entry Credit: $1.00
Profit Target: $0.50 ($1.00 Entry Credit – $1.00 x 50%)
Loss Limit: $2.00 ($1.00 Entry Credit x 200%). A $2.00 loss would occur when the call option traded $3.00 ($1.00 Entry Credit + $2.00 Loss).
Metrics We’ll Analyze
Before we get started, I want to quickly cover the primary metrics we’ll analyze:
Win Rates: The percentage of trades that were profitable.
Win Rate – Breakeven Win Rate: The difference between the success rate and what the strategy required to break even (based on average profits and losses).
Average P/L: The average profitability of each trade. The average P/L figures will be consistent with the Win Rate – Breakeven Win Rate levels.
10th Percentile P/L: The P/L that 90% of trades exceeded (a probabilistic way of analyzing the worst drawdowns).
45-Day Adjusted P/L: Not all trades were held for the same amount of time. We standardized the average P/L of each trade to a 45-day period.
Win Rates: 16-Delta Short Calls
By closing profitable short call positions early, the success rates increased. Conversely, success rates declined when closing losing short call trades early:
To clarify the x-axis on these charts, I wanted to run through a quick example of how to interpret the labels. The following format is used: Profit Target / Loss Limit. If “Exp.” is present in one of those spots, then that combination had no profit target (if “Exp.” is first) or loss limit (if “Exp.” is second).
For example, “25% / Exp.” means the trades were closed for 25% of the maximum profit potential OR held to expiration (no loss management).
“Exp. / -200%” means the trades were held to expiration (no profit management) OR closed for a -200% loss.
Win Rates – Breakeven Win Rates
The Win Rate – Breakeven Win Rate metric helps us understand how each strategy performed relative to the required success rate to break even over time. For example, if a strategy’s average profits and average losses require a 75% success rate to break even, then a success rate of 80% would result in a Win Rate – Breakeven Win Rate of 5% (80% Realized Success Rate – 75% Required Breakeven Win Rate).
The metric puts more context around success rates.
Let’s take a look at the Win Rate – Breakeven Win Rate statistics for the short call trades:
As we can see, many of these short call management strategies barely cleared the required success rate that would result in breaking even over time (based on average profits and average losses).
The results make sense, as we’ve been in a strong bull market period since 2009, which means many of these short call positions were likely “blown out” as the S&P 500 moved higher in a swift fashion.
Average P/L Per Trade
Which short call management strategies were the most profitable, on average?
Based on these figures, we can see that most short call strategies in the S&P 500 have been only slightly profitable. Obviously, this can be attributed to the bull market period from 2009-2017 (the time of this writing).
Additionally, when factoring in commissions, most of these approaches may actually end up with losses, on average (depending on the commission rate).
For example, if we assume a trader’s commissions are $1 per option contract, then it costs $2 in commissions to open and close one short call contract. Based on a $2 round-trip fee, we can subtract $2 from the above Average P/L figures to get the average P/L per trade after commissions.
10th Percentile P/L
If you recall, the 10th percentile P/L tells us the P/L level that 90% of trades exceeded. For example, if the 10th percentile P/L is -$750, then 90% of short call trades had a P/L better than a loss of $750.
Let’s take a look at these “worst-case” drawdowns for each short call management approach:
As we might expect, taking losses substantially reduced the worst-case drawdowns.
Additionally, by not taking losses and managing profits sooner (25% or 50% of the maximum profit potential), the 10th percentile P/L was worse than the larger profit-taking combinations, as the larger profits help offset the losses.
Average Time in Trade
How long was each short call position held for, on average?
As we’d expect, incorporating some type of profit or loss management results in fewer days in each trade, on average. How does the reduced time in each trade impact the hypothetical average P/L for these short call positions over similar time periods?
To answer this question, we’ll adjust the average P/L per trade of each approach to a 45-day period:
45-Day Adjusted Average P/L = Avg. P/L Per Trade x (45 / Avg. Days in Trade)
Of course, this isn’t a perfect formula, but it does help put context around the “average profitability” of each approach based on the number of trades that can “fit” into similar periods of time.
After adjusting each short call management strategy’s average P/L per trade to a 45-day period, we find that the 25% to 50% profit targets generated the most profits, on average.
However, keep in mind that opening and closing trades more often will generate more commission costs.
What would the profitability of these strategy’s look like when taking out $2 per round-trip trade? That is, a $1 commission rate per contract multiplied by two (one trade to open the position and one to close it).
Let’s take a look:
45-Day Avg. P/L – Commissions = 45-Day Avg. P/L – [(45 / Avg. Days in Trade) x $2]
While not a perfect estimation, the above graph should help put context around the commission impact of managing profitable trades sooner and ultimately trading more often.
These figures suggest that the 50% profit target level has historically had a good balance between the average P/L per trade, number of trades, and commissions for trading more often.
Additionally, the -100% loss limit has historically had the worst performance compared to the other short call management approaches, which suggests taking losses at -100% of the credit received has been “too soon.”
In other words, many of the short call positions that reached the -100% loss level came back and ended up as profitable trades.
Short Call Performance by VIX Level
In this final section, we’ll analyze some of the metrics from above, but we’ll evenly divide all of the trades into four buckets based on the VIX level at the time of entering the short call trades:
1. VIX Below 14
2. VIX Between 14 and 17.5
3. VIX Between 17.5 and 23.5
4. VIX Above 23.5
These VIX levels were selected based on the 25th, 50th, and 75th percentile of VIX levels at the time of all trade entries. By using these percentiles, we evenly divide all trades into four separate buckets and avoid any one bucket having substantially more or less occurrences than the rest.
Short Call Win Rates by VIX Level
At a quick glance, we can see that many of the short call management combinations had the highest success rates in the lowest and highest VIX environments:
How did these success rates compare to the required success rate to break even?
Win Rates – Breakeven Win Rates by VIX Level
As we can see, not all approaches had a win rate higher than what was required to break even (based on average profits and average losses):
Again, the lowest and highest VIX environments were the best-performing volatility environments for most of the short call management approaches.
Short Call Average P/L by VIX Level
Consistent with previous findings, the lowest and highest VIX environments have generated the highest average P/L per trade for most of the short call management approaches:
Interestingly, the best-performing groups included selling calls in the highest VIX environment and using a wide stop-loss (-200% or -300%) combined with high profit targets (75% or hold to expiration).
10th Percentile P/L by VIX Level
Similar to the short put management results, the largest short call losses occurred in the highest VIX entries:
When the VIX is high, it’s typically due to a recent downturn in the market. Since 2008, nearly every significant market dip (and therefore VIX spike) has been met with a strong and quick rally to the upside, which causes problems for short call positions.
45-Day Adjusted Average P/L by VIX Level
When normalizing each approach’s average P/L per trade to a 45-day period, we get the following results:
45-Day Average P/L = Avg. P/L Per Trade x (45 / Avg. Days in Trade)
Based on the data, closing profitable short call positions sooner (25-50% of max profit) has typically performed the best in the lowest VIX entry category, suggesting that holding longer for more profits has led to more short call positions getting “blown out” as the S&P 500 moved higher.
The short call management approaches that performed the best in the highest VIX entries included a generous stop-loss (-200% or -300%) with early profit management.
Checklist
While we’ve covered a ton of data in this post, here are the most important findings:
✓ Historically, the 16-delta short call strategy has performed best in high VIX environments when paired with a high profit target (50-100%) and a generous stop-loss (-200% or -300%)
✓ When factoring in a $1 commission per option contract, many of the short call management approaches analyzed in this study were not profitable. The ones that were probably were not worth the risk, as the profits after commissions were so small (resulting in very poor risk/reward).
✓ Lastly, the largest short call drawdowns have occurred in high VIX environments, which explains why adding a -200% or -300% stop-loss has been beneficial for high implied volatility entries.

New to options trading? Learn the essential concepts of options trading with our FREE 160+ page Options Trading for Beginners PDF.

About the Author
Chris Butler received his Bachelor’s degree in Finance from DePaul University and has nine years of experience in the financial markets.
Chris started the projectfinance YouTube channel in 2016, which has accumulated over 25 million views from investors globally.


