Last updated on March 31st, 2022 , 10:13 am
Trading Earnings With Options
The Basics of Earnings
Publicly traded companies are required by the Securities and Exchange Commission (SEC) to update shareholders on their performance on a quarterly basis. These reports are highly anticipated by shareholders because they give them a window into a company’s financial health.
Typically, earnings per share (EPS) and revenue are the two most important components of an earnings report for investors. In addition to these two metrics, a company is required to communicate numerous accounting details to their shareholders in their earnings report. Some of these numbers include a company’s:
- Net Income
- Operating Expenses
- Cash Flow
Companies also provide within their earnings report guidance for future expected performance. Sometimes, a positive forecast can help offset poor financial performance and vice versa.
Companies typically issue earnings around the same time. This period is known as “earnings season”, and it happens every quarter. 2022 is shaping up to be a particularly volatile year in regards to earnings.
When compared to stock, options offer investors more ways to capitalize off of earnings-related stock moves.
Earnings and Volatility
Leading up to a company’s earnings report (which is typically released just before market-open or after market-close), a stock’s share price becomes more volatile. Once the information within the report has been disseminated, the volatility typically returns to its normal levels.
The market’s interpretation of earnings reports is not always black and white. Sometimes, a company can post extraordinary financials, but a poor forecast can send the stock plummeting.
Other times, a stock can either soar or tank for no apparent reason. Earnings reports on companies like Amazon (AMZN) can sometimes baffle investors. It isn’t uncommon for this stock to soar hundreds of dollars on the tail of an earnings announcement, only to open lower the next day. And why does the stock go down? Many analysts give their opinions, but a lot of the time, nobody knows – no matter what they say.
What interests us as option traders here is the volatile environment leading up to an earnings call. To see how reactionary option contracts are to earnings, take a look at a front-month (the closest expiration cycle) options chain on a stock before and after earnings. If the earnings report was in line with expectations, you’ll see every single option contract trading at a significantly reduced price.
Traders Love Volatility
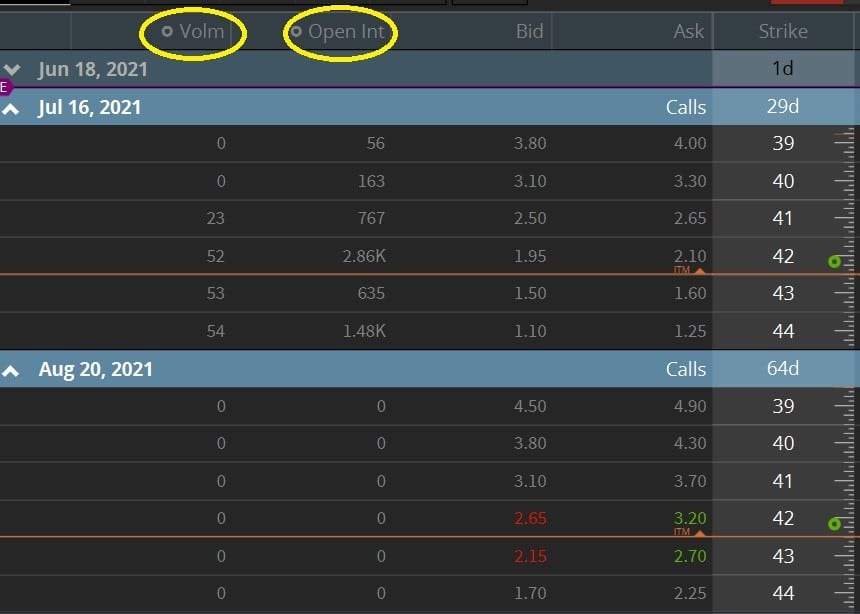
This collapse in price is known in the industry as “vol crush” (volatility crush – Nasdaq). Option traders love volatility, and stocks are typically at their most volatile leading up to an earnings report. To prove this, just take a look at the pre-earnings report volume and open interest of call options for Plug Power Inc (PLUG) below, courtesy of tastyworks. These numbers are typically inflated going into earnings.
Take note of how the options volume quite literally falls off a cliff for the August expiration, which is post-earnings.
Options markets can even give us a general idea as to how far a stock will rise or fall post-earnings. How is that possible? Let’s examine the “expected move” next.
The Expected Move
Before we get into understanding how a straddle can do a decent job at predicting the expected move of a stock post-earnings, we must first understand implied volatility, which tells how inflated the volatility is for a particular option expiration cycle.
Implied Volatility
The implied volatility of a stock, or “IV”, uses options to estimate the future volatility of a stock. The IV is of particular importance to those trading options on stocks going into earnings.
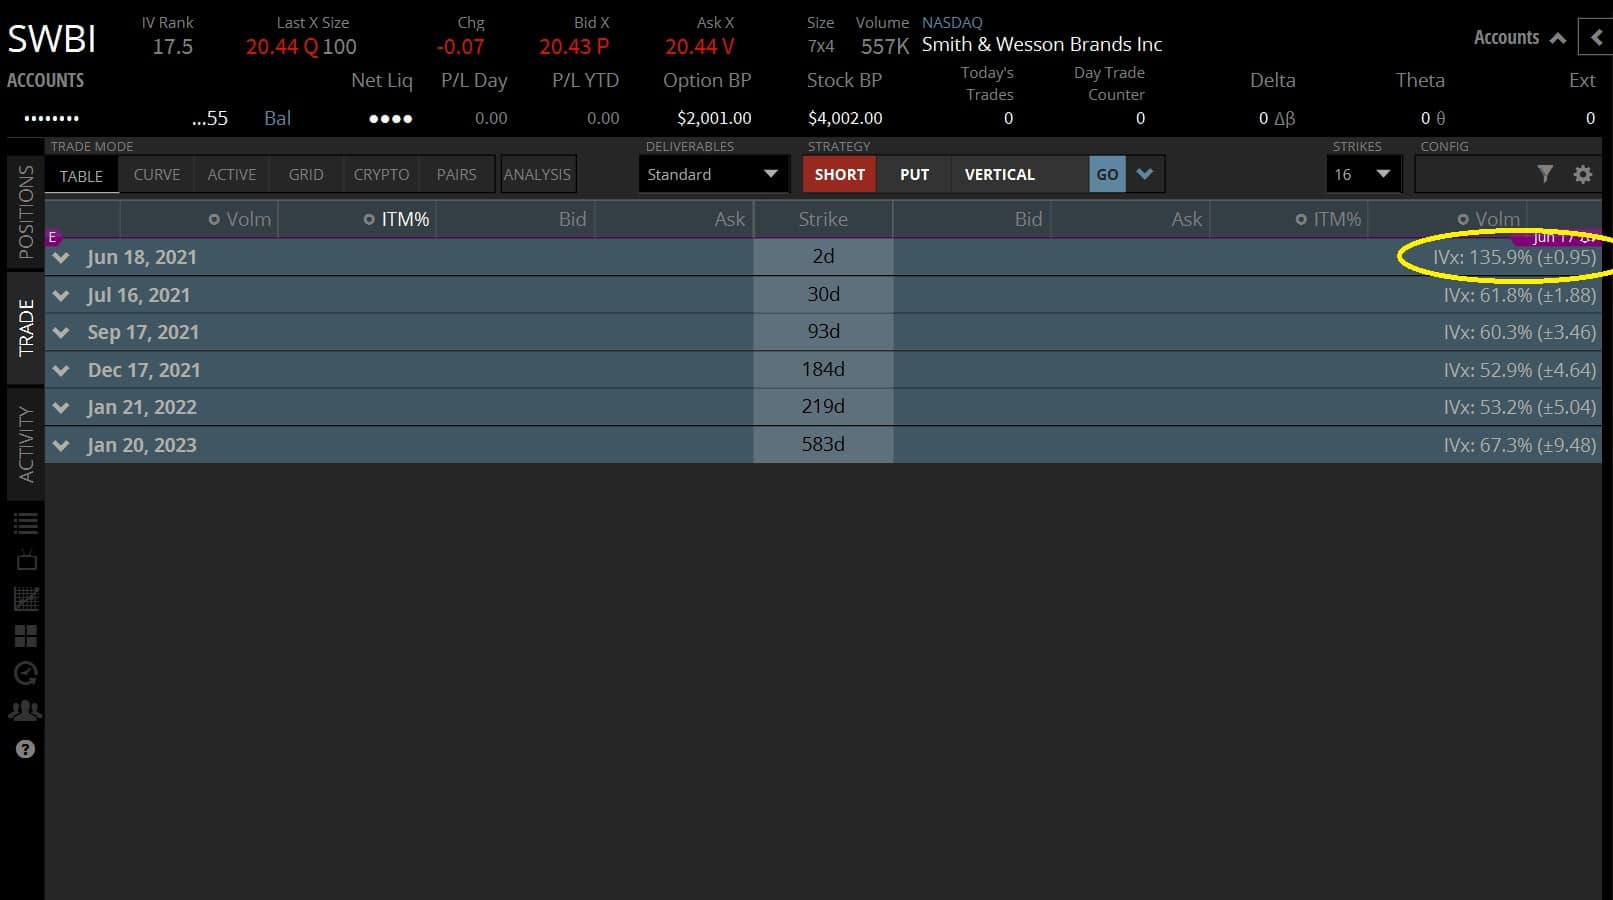
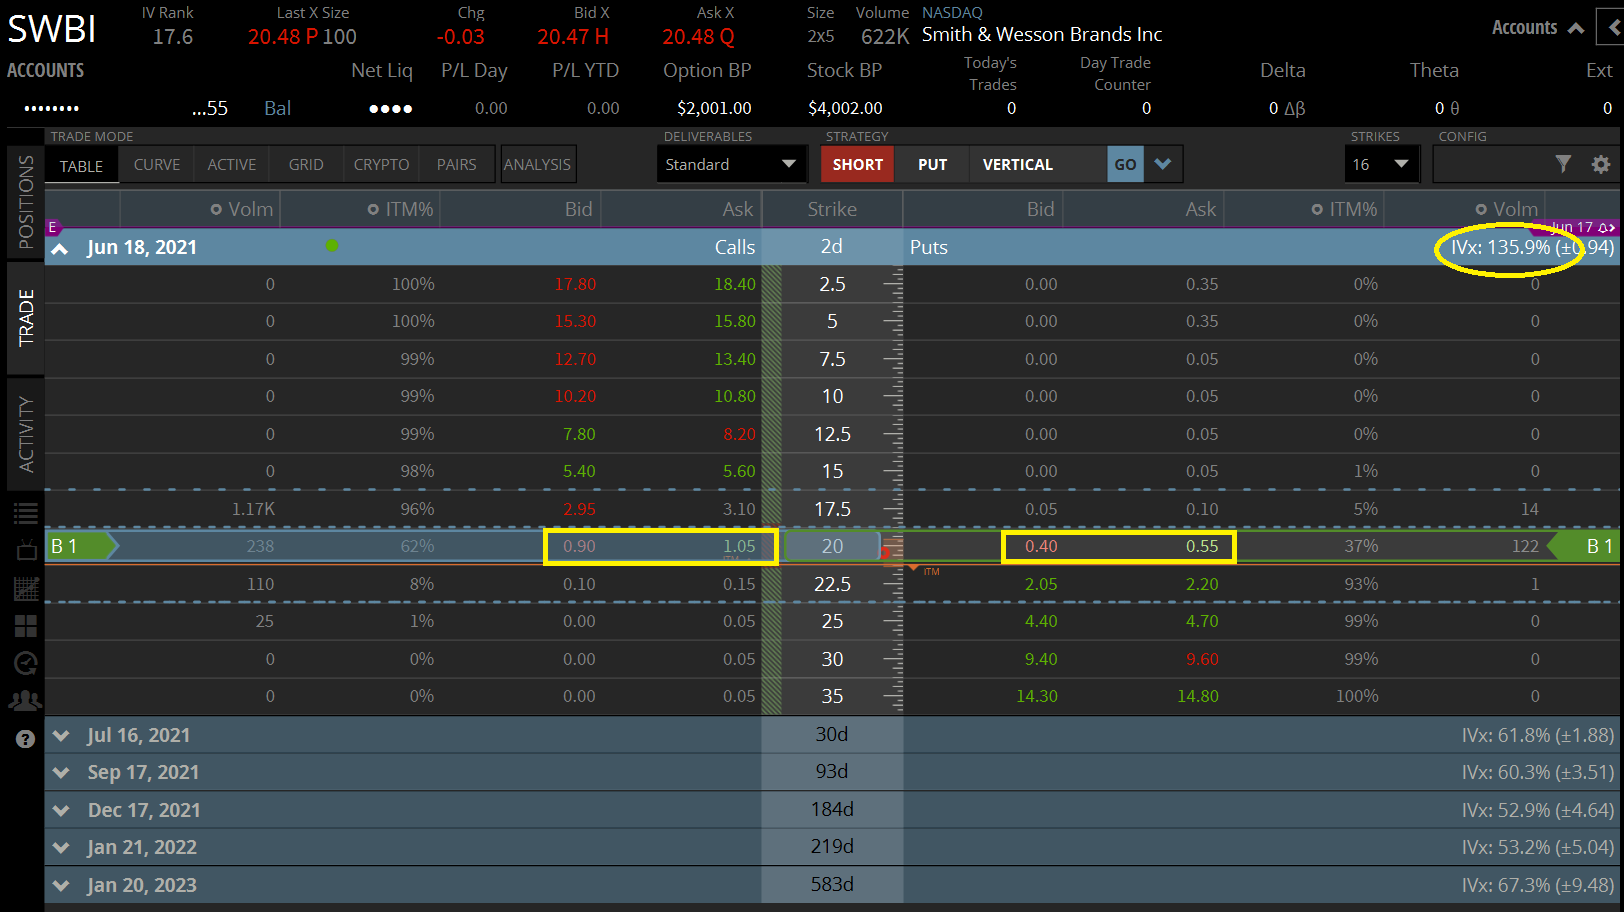
To see how “IV” increases for near-term (or “front-month”) option expirations, take a look at the image below (click to enlarge). This screenshot (taken from tastyworks) shows the options chain for Smith & Wesson Brands Inc (SWBI), which will release earnings later this week.
We can see that the SWBI options expiring in 2 days, the June 18th cycle, have an “IV” of 135.9%. Compare that to the IV of other months, which have an average IV of between 50% and 60%. This means the premium of these contracts has twice as much juice as those of later months.
Why? SWBI was slated to post earnings after the market on this day. Earning means more uncertainty, and uncertainty is synonymous with volatility. After the earnings are released, the volatility affecting these front-month options will likely fall dramatically to be in line with the IV of other expirations.
Volatility Crush
This is referred to as the “Vol Crush” (volatility crush) we touched on earlier. Many beginner options traders learn about vol crush the hard way. I can’t tell you how many absolutely baffled customers have called me trying to figure out why their long call was down post-earnings when the stock was up. I explain to them vol crush; that not only do you need the stock to go up post-earnings for a long call to profit, but you’ll also need it to go up a lot.
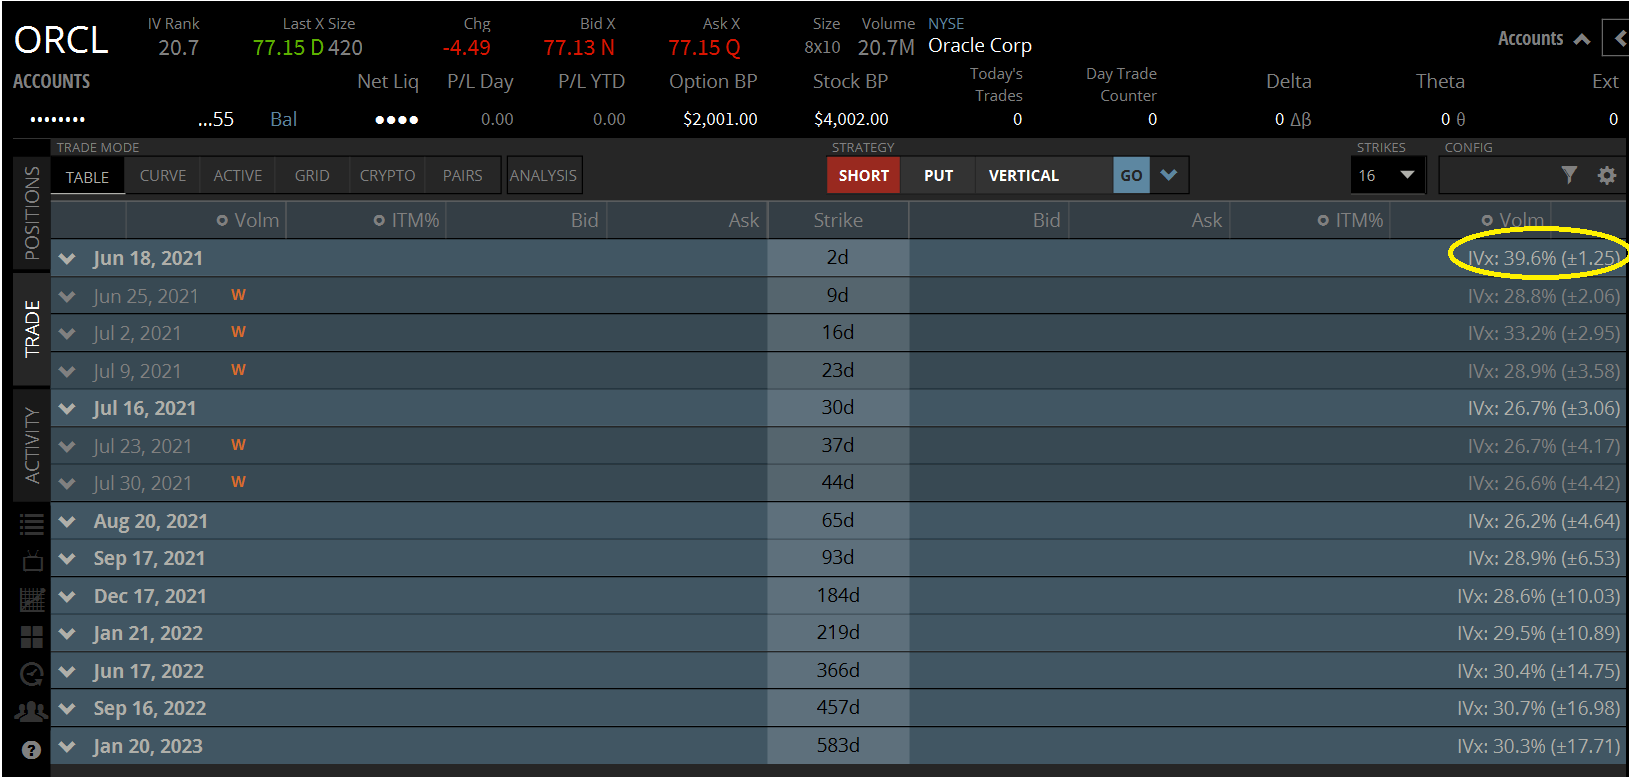
The below image (courtesy of tastyworks) shows the implied volatility of Oracle (OCRL), which just released earnings the day before this article was written. Take a look at the implied volatility of the front-month options.
With the uncertainty removed, the front-month options have more fell in line with the options of other expiration cycles. You may notice that the front month IV is still slightly elevated. This could be because the earnings were poorer than expected, and ORCL is down significantly today. Investors have not yet digested all the news, and therefore the volatility has not settled completely, but it has fallen significantly.
Straddles Measure a Stock's Expected Move
The expected move (or range) of a stock can be determined by using the “Straddle” options trading strategy. The legs of this straddle must consist of the nearest-term expiration listed for a stock and also of an expiration that expires after the earnings are released.
Options expiring a year out are bound to behave less reactionary to earnings when compared to options expiring next week. So make sure you look at the “front-month” options series when checking the straddle.
A straddle simply involves buying (or selling) the at-the-money call and the at-the-money put option together on the same expiration. Since we are only using this strategy as a tool to gauge movement, it doesn’t matter if we are buying or selling. We’re only concerned with the net premium.
Let’s say a stock is trading at $100 and its earnings will be released tomorrow. We can look at the option chain expiring next week to get an idea of the stock’s expected move post-earnings. We do this by adding the combined value of both the at-the-money call and put. Let’s review how straddles work before we move on.
Straddle Mechanics
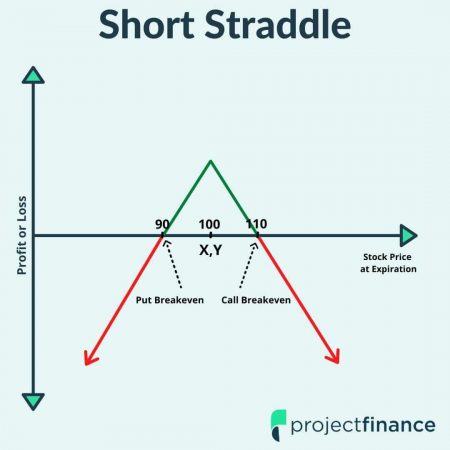
So let’s assume we don’t believe a stock is going to move at all post-earnings. The stock is currently trading at $100/share. We decide to sell a straddle on this stock by selling the at-the-money 100 call (Y) and the at-the-money 100 put (X), as illustrated in the graph above.
Both of these options were valued at $5, so the total premium we took in was $10, which is also the expected move of the stock post-earnings. As long as the stock stays within this $10 range, we will see a profit on the short strangle. If the stock closes at $100/share on expiration, we will realize our max profit of $10.
On the other hand, if we thought the stock was going to move a lot, we would instead buy a straddle. For a long straddle purchased for $10 on this stock, we would need the stock to go outside this range (above 110 or below 90) in order to break-even and realize a profit. When you buy a straddle, there is no cap on your profit, as the stock could in theory go to infinity. When you sell a straddle, your profit is limited to the credit received.
Let’s take a look at a real-world example of a straddle now on Smith & Wesson (SWBI), which will release earnings later this week.
SWBI Straddle
We can see from the image above that the front-month straddle for SWBI (consisting of both the June 18th 20 strike price call and put) is trading at $1.50 ($1 + $0.50 going off the mid prices). Since the stock is trading higher than 20 at 20.48, this straddle will not be precise. But since it is not earnings season and pickings are slim, we will have to live with it. This means that the stock of SWBI is expected to move by approximately $1.50 post-earnings, which is tomorrow.
If you were to buy this straddle for $1.50, you would need the to stock to either: a) rise to $21.50/share or b) fall to $18.50/ share in order to break even on our straddle. Beyond those parameters is increasing profit.
If you were instead to sell this straddle, your max profit would occur if the stock closes at $20 on expiration post-earnings. In this instance, you would collect the full premium of $1.50. Your max loss would in theory be infinite since there is no cap on how high a stock can go.
Options Strategies for Earnings
Though the straddle is a great strategy to gauge in theory where a stock may move post-earnings, in practice, straddles are one of the riskiest options trading strategies.
If you sell a straddle, your max loss is infinite. When you buy a straddle, not only is it going to cost you a lot of money, but you will need the stock to make a very large move just to break-even.
But just because we don’t want to take on the risk that comes with trading straddles doesn’t mean we can’t get in on the earnings action. Let’s take a look at a few options strategies with limited loss potential to utilize during earnings season, beginning with the short iron condor.
1) Iron Condor
The iron condor is a great earnings play options strategy. You can either buy or sell an iron condor. The below graph represents a short iron condor, which is the more popular way to trade earnings.
- The seller of an iron condor is market neutral and expects the stock will remain within the bounds of the two options (call and put) that are sold. These trades are thus considered market neutral.
- The buyer of an iron condor is directional and believes the stock will either increase or decrease in price beyond the bounds of the two options (call and put) purchased.
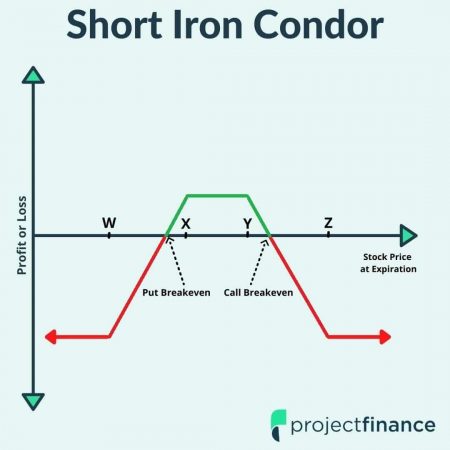
The iron condor is very similar to the strangle strategy. A strangle consists of buying (or selling) a call and a put option with different strike prices, but with the same expiration date. The only difference is with the iron condor, we have purchased options to help hedge our risk.
A chart for a short strangle would be very similar to the chart of the short iron condor above. With an iron condor, the loss levels out at the strike price of our options purchased. For a strangle, these red arrows continue to go down. Take a look at how a short strangle looks below.
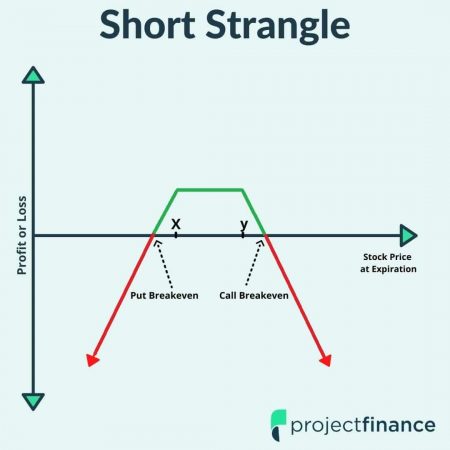
It is because of this risk that most beginner traders are better off trading iron condors.
If you’d like to learn more about both the long and short iron condor strategy, watch our videos below.
Iron Condors Explained
2) Iron Butterfly
The iron butterfly is another great defined-risk options strategy to use during earnings. If the iron condor is a great risk-defined strategy when compared to the strangle, then the iron butterfly is a great risk-defined alternative to the straddle, which we talked about earlier as a measurement of expected move.
You can both buy and sell iron butterflies:
- The seller of an iron butterfly is market neutral and believes the stock will stay within a specific range.
- The buyer of an iron butterfly is directional and expects a significant stock move in either direction
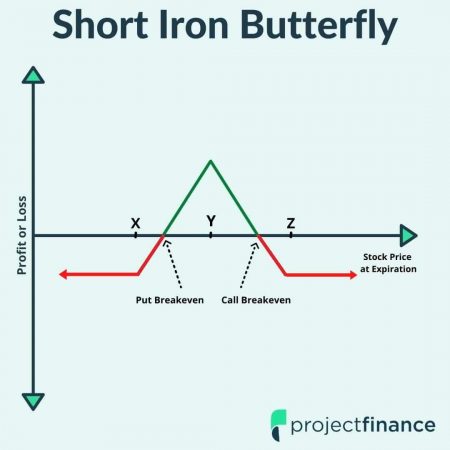
A short iron butterfly is popular for options trading earning plays because it takes advantage of the elevated volatility. This strategy can be thought of as simply a short straddle with an added long strangle for protection. Additionally, a short iron condor can be thought of as an iron condor where the short call and short put options are of the same strike.
A downside of selling an iron butterfly (and iron condor) is that you will not collect the full amount of the expected move because you are buying long options against the short straddle (or strangle for the iron condor).
For more insight into both the long and the short iron butterfly, check out our videos below.
Iron Butterfly's Explained
Locking in Profits
Sometimes, it is possible to lock in profits early on earnings plays. Here are two methods of how to do this.
1. Trade Out Pre-Earnings
Though incredibly risky, and often compared to gambling, trading options pre-earnings reports can provide some advantages to options traders. One advantage is what I like to call the “free look”.
Let’s say you think a stock is going to make a big move post earning later today after they are released. You decide to purchase a straddle right after the market opens.
Stocks are notoriously volatile in the days and hours leading up to an earnings report. If shortly after you put this trade on the stock rallies hard and fast, you could trade out of the position and lock in a profit and not even have to worry about what the earnings are.
On the other hand, if the stock doesn’t move at all, you can simply wait and hope for what you originally intended – a big swing post-earnings.
Another way to lock in options profits on earnings plays is by buying or selling shares of the underlying stock. Let’s see how that works next.
2. Stock Hedge: Amazon (AMZN) Example
Let’s say you bought a straddle on AMZN at the 2,000 strike price for $50 just before the earnings report came out. You need the stock to rise to $2,050 (for the call) or $1,950 (for the put) in order to break even.
On the immediate tail of their earnings, we’ll say AMZN rallied all the way to $2,200/share. Since you paid $50 for this straddle, you just made $150 on the trade. Not bad!
But who knows where AMZN will be trading tomorrow when the options markets open again? In theory, you could hedge the profits on the long call part of your straddle by selling the stock in the after-hours market for $2,200. The downside of this, of course, is you need the capital to hold 100 shares of stock. Do you have $220k laying around? Probably not. Sometimes, your broker will work with you here, but most of the time, you’ll be on your own.
It can therefore be wise to trade options on stocks that you can afford to hedge.
Conclusion
Trading options going into earnings is very risky and the equivalent of gambling. That being said, a lot of money can be made…and lost. The most important thing to understand when placing a trade before an earnings report is risk. Know your risk!
Know too that the stock may not react the way you think it will. Many times, after a few swings, a stock settles right back to where it started.
It is because of this that most professional traders prefer to sell option premium going into earnings. This non-directional bet is known as being “market neutral”. If you’d like to learn a few more market-neutral strategies, feel free to check out our article, “5 Options Strategies for a Sideways Market”.
Happy trading.

