Last updated on May 3rd, 2022 , 08:48 am
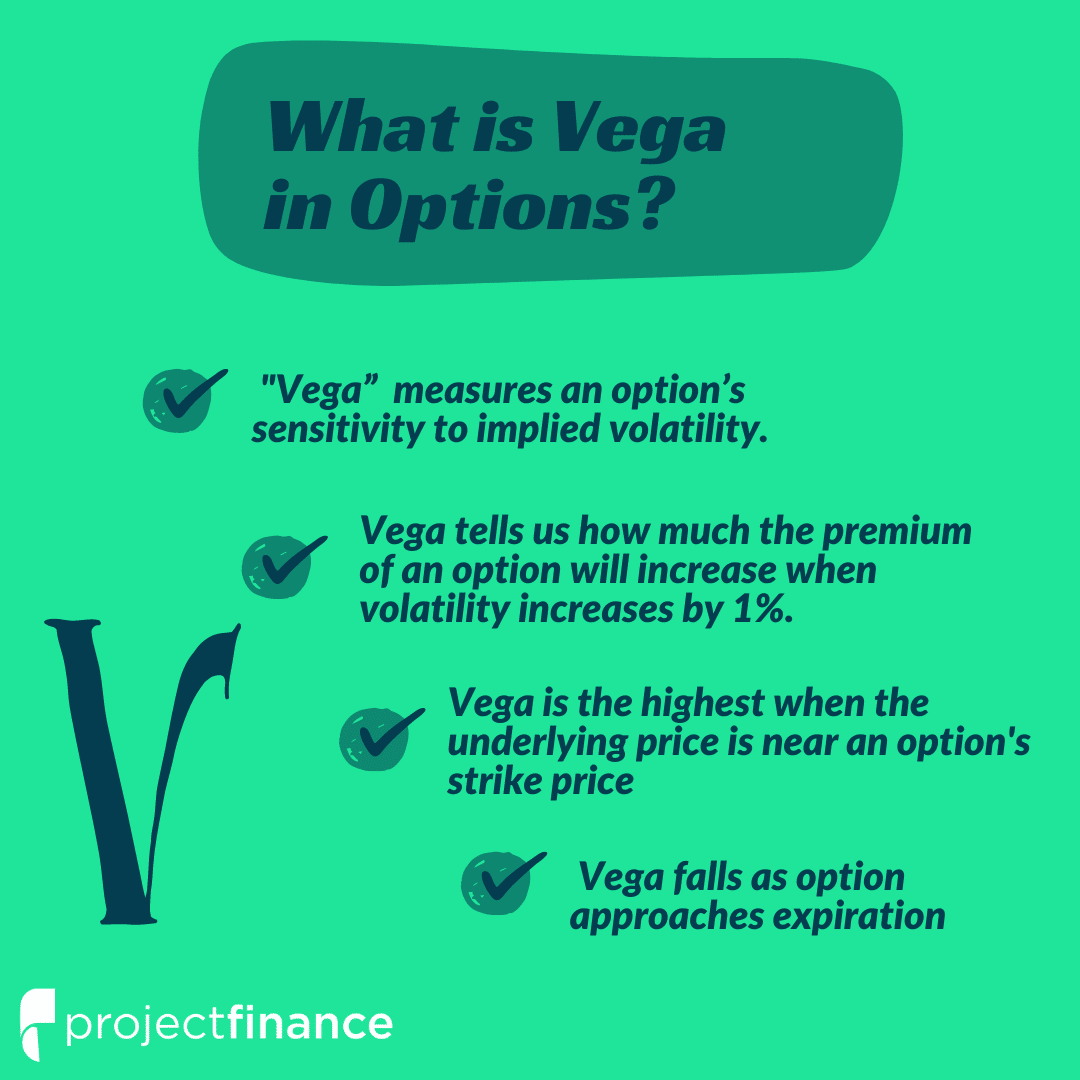
Option Vega Definition: In options trading, the Greek “Vega” (Greek letter v) measures an option’s sensitivity to implied volatility. Vega tells us how much the option premium of a derivative will increase by when volatility increases by 1%.
What Is Vega In Options Trading?
Before we get into what an option’s vega is, let’s review the biggest risks every options trader must be aware of:
1) Changes in the price of the stock (directional risk – delta)
2) Changes in the directional risk of a position (gamma risk)
3) The passing of time (referred to as time decay or theta decay)
4) Changes in implied volatility of the underlying asset (volatility or vega risk)
5) Changes in interest rates (Rho)
Vega is the option Greek that relates to the fourth risk, which is volatility or vega risk. More specifically, vega estimates the change in an option’s price relative to changes in implied volatility.
Read! Historical Volatility vs Implied Volatility
Vega is always presented as a positive number because as option prices increase, implied volatility increases (all else equal). Conversely, as option prices decrease, implied volatility decreases. Let’s go through some examples of how vega is applied.
Care to watch the video instead? Check it out below!
Basic Option Vega Example
Vega is expressed as an option’s expected price changes relative each 1% (absolute) changes in implied volatility.
In the following table, work your way from left to right, and notice how an option’s price is expected to change relative to movements in implied volatility:
As you can see, an option vega of 0.25 represents a $0.25 increase in the option’s price per 1% increase in implied volatility, and vice versa. With a 3% decrease in implied volatility, the option’s value is expected to be $0.75 lower.
In order to estimate an option’s expected price relative to a 1% increase in implied volatility, simply add the option’s vega to its price. For 1% decreases in implied volatility, an option’s price can be estimated by subtracting vega from its price.
Nice! You’ve learned the basics of an option’s vega! We’ve just got one more section to go. Next, you’ll learn about the options with the most vega risk.
Which Options Have the Most Vega?
In this section, we’re going to analyze various call options and put options to determine which ones have the most exposure to changes in implied volatility.
To do this, we’ll run a series of tests. First, we’re going to look at option vega values at each strike price. Then, we’ll analyze the vega of options with shorter and longer amounts of time until the expiration date. Let’s do it!
Option Vega vs. Strike Price
To illustrate which options have the most exposure to vega, we picked a random day in 2016 and graphed the vega of each out-of-the-money (OTM) call and put. We used the expiration cycle with nearly 50 days to expiration. Let’s take a look at the results!
As illustrated here, option contracts closest to the underlying stock price (at-the-money or “ATM”) have the highest vega values. In this particular example, the at-the-money options are expected to be worth $0.28 more with implied volatility 1% higher, and vice versa. On the other hand, an out-of-the-money put with a strike price of 170 is expected to increase by only $0.07 relative to each 1% increase in implied volatility, and vice versa.
Another thing this graph tells us is that an option’s vega is related to the amount of extrinsic value it has because at-the-money options have the most extrinsic value, and out-of-the-money options have the least amount of extrinsic value.
Read! Determining the Price Of An Option – Intrinsic Value vs Extrinsic Value in Options
Alright, we’ve checked off the first analytical test. Now, we’re going to build on this by analyzing the vega of each option over multiple expiration cycles.
Vega vs. Time to Expiration
Similar to before, we’re going to graph the vega of each out-of-the-money option, but this time we’ll do it for three expiration cycles. The cycles we chose were 15, 71, and 225 days to expiration, respectively. Let’s check it out!
As we can see here, options with more time until expiration have larger vega values. This means that longer-term options are expected to have more volatile price changes relative to implied volatility changes. Again, this makes sense because longer-term options have more extrinsic value.
To understand why options with more extrinsic value have higher vega values, consider the following hypothetical scenario:
Now, if these option prices both went to $0, implied volatility would be 0%. In order to reach $0, Option B has to lose $0.75 while Option A only has to lose $0.25. Therefore, Option B has a larger vega value.
Vega Calculation Using Black Scholes
According to columbia.edu, the below pricing model formula satisfies Vega:

Note! Trading options come with great risks. To better understand the risks of standardized options, please read this article from the OCC.
Option Vega FAQs
Vega tells us how much the price of an option will change in response to a 1% change in the implied volatility of the underlying. Option prices rise with implied volatility.
In options trading, a negative vega implies a net short position. This applies for both short single options and short spreads.
Options that are trading at-the-money are most sensitive to changes in implied volatility. Therefore, at-the-money option have a higher vega than in-the-money and out-of-the-money options.
Next Lesson
Additional Resources


Thanks for the read. I’m trying to figure out why option that are at-the-money have the highest vega. Any idea why? It seems like out-of-the-money options should have the higher vega.