Last updated on May 9th, 2022 , 11:24 am
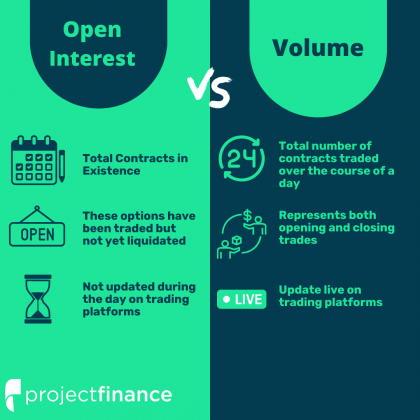
One of the things every options trader should do before entering a position is gauge the amount of trading activity in the options they wish to trade. Failing to run a quick liquidity check can leave an options trader stranded in a position, forced to exit at an unfavorable price.
Two metrics that every options trader should look at before entering a position are volume and open interest.
Care to watch the video instead? Check it out below!
What is Option Volume?
An option’s volume is the total number of contracts that have been traded on that trading day. For example, if an option has a daily volume of 15,000, then 15,000 contracts of that option have traded on that particular trading day.
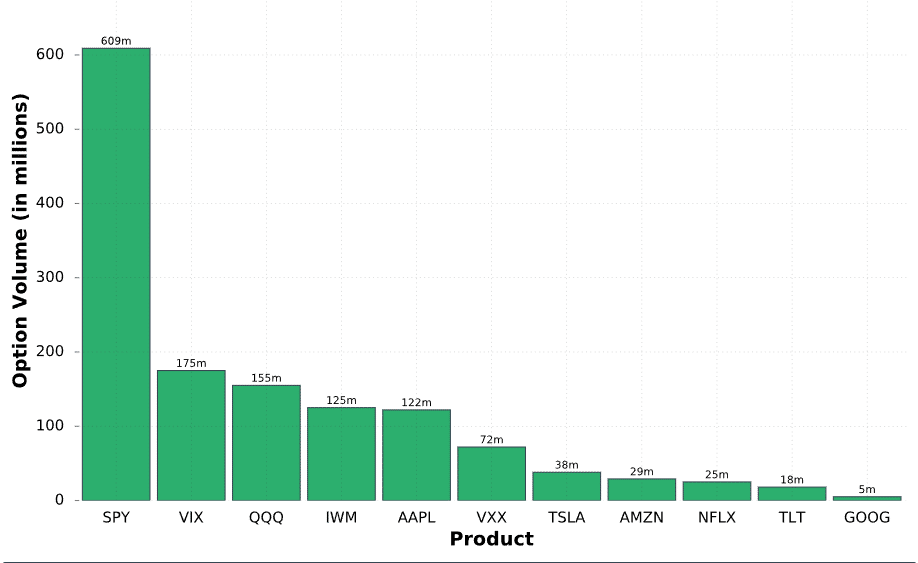
The following chart shows the estimated total number of option contracts that were traded for various products over 1 year:
As we can see here, almost a billion option derivatives were traded among the top four products in the options markets, which indicates SPY, VIX, QQQ, and IWM options are very actively traded. With that said, every product included in the above chart is very actively traded.
Next, we’ll talk about open interest.
What is Open Interest?
In the stock market, an option’s open interest represents the total number of contracts that are “open” between any two parties. In other words, open interest is the number of option contracts that have been opened, but not yet closed. Let’s run through a basic example to demonstrate how open interest works.
Open Interest Example
Consider the following trade orders that are routed by two different traders, but on the same option contract:
Here, Trader A is buying-to-open 5 contracts to open and Trader B is selling 5 contracts to open. Both of these simple trading strategies are new positions.
If both traders are filled on their orders, the option’s open interest will increase by 5 because two traders have opened positions in that contract.
What happens when one of the traders closes their position while another trader opens a position? Consider the following trades:
As we can see here, Trader B bought 5 contracts to close while Trader C sold 5 contracts to open. In this case, open interest remains at 5 because there are still 5 contracts open between Trader A and C. However, if Trader A sells 5 contracts to close and Trader C buys 5 contracts to close, open interest will decrease by 5:
So, open interest represents the number of option contracts that are open in the market between two parties, though you don’t need to be concerned about the specific parties.
In summary, open interest increases when two parties get filled on opening orders, and decreases when two parties get filled on closing orders. When one party has an opening order and the other has a closing order, opening interest will not change (assuming both orders have the same number of contracts).
The Importance of Option Liquidity
An option’s volume and open interest are very important to you as an options trader because you do not want to get caught trading illiquid options (low volume and low open interest). Illiquid options tend to have wide bid-ask spreads, which can single-handedly wipe out a trading account over time.
Additionally, it’s harder to get out of option positions at good prices when volume and open interest are low, which means losses may grow larger due to the inability to exit a position.
What are ideal levels of volume and open interest? At the bare minimum, the options you use for your positions should have volume in the hundreds and open interest in the thousands:
Minimum Daily Volume: 100s, preferably 1,000s.
Minimum Open Interest: 1,000s.
At this point, you understand the basics of volume and open interest, and why they’re important to you as an options trader. In the next section, we’ll go over which options on a stock tend to have the most of each.
Which Options are the Most Liquid?
So, you know what option volume and open interest are, but which options tend to have the highest of each? To answer this, we’re going to run through some data on two of the market’s most actively traded products: the S&P 500 ETF (SPY), and Apple Inc. (AAPL).
First, we’re going to compare the volume and open interest of SPY options at each strike price on a single trading day. Then, we’ll look at different expiration date cycles.
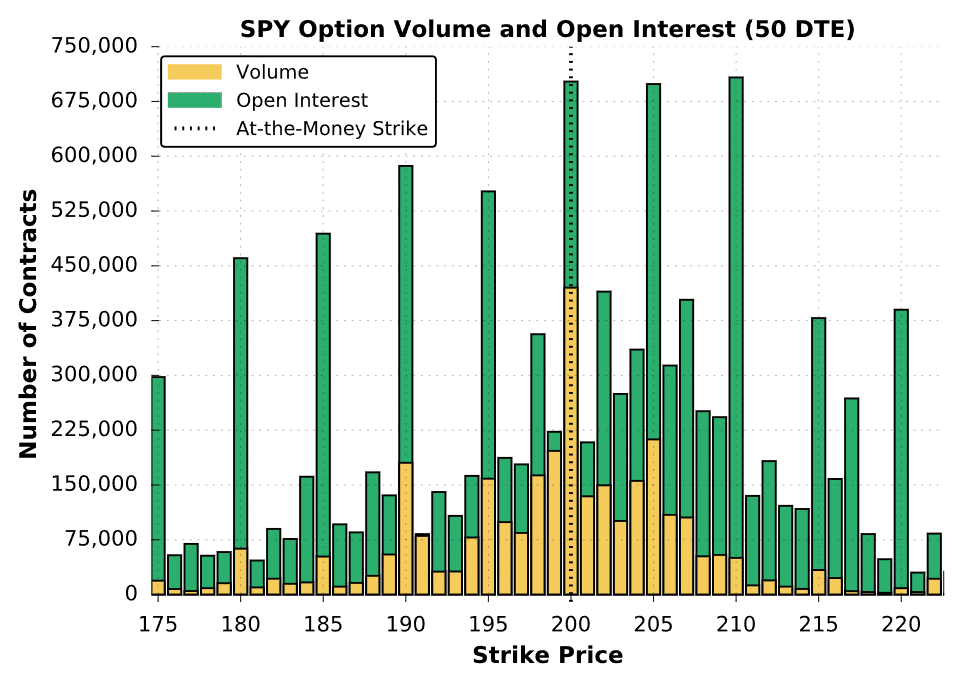
To analyze the volume and open interest based on the strike price, we chose a day from earlier this year and plotted the volume and open interest of calls and puts at each strike price. We used the expiration cycle with approximately 50 days to expiration. Let’s take a look:
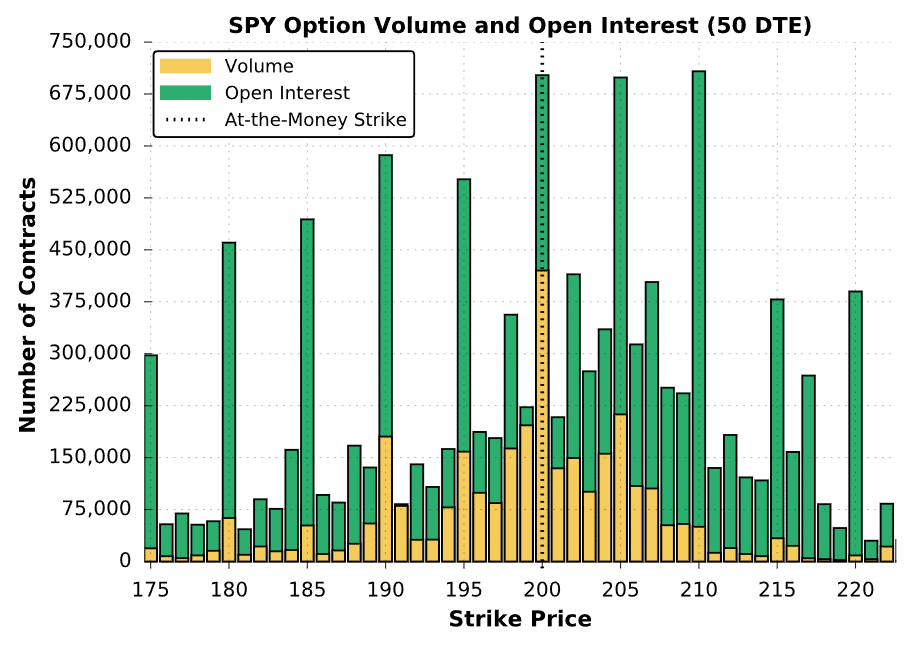
Regarding volume, we can see that the most actively traded options are the ones with strike prices near the stock price (at-the-money options). Less and less trading volume tends to occur in the options that are further away from the stock price.
Regarding open interest, we can see that even strike prices (185, 190, 195, etc.) have the highest open interest (and higher volume), suggesting that market participants prefer to trade even strikes as opposed to uneven strikes (187.5, 192.5, etc.).
So, options with strike prices close to the current stock price tend to be the most actively traded. Additionally, options with even strike prices tend to have the highest open interest because market participants prefer even strikes over uneven strikes.
Next, we’ll compare the volume and open interest across multiple expiration cycles.
Option Liquidity vs. Time to Expiration
In this next section, we’ll use SPY and AAPL options to analyze the volume and open interest across multiple expiration cycles. In both examples, we chose a day earlier this year and analyzed the volume and open interest for multiple expiration cycles. Let’s start with SPY:
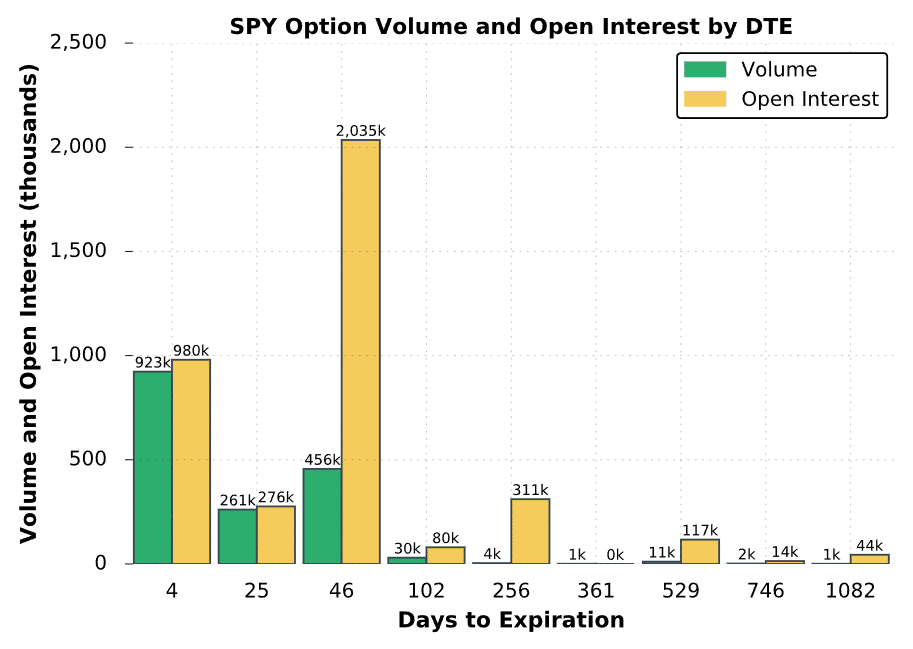
Here, we can see that the near-term expiration cycles clearly have the highest volume and open interest compared to the longer-term expiration cycles. In this case, the 46-day expiration cycle has the highest open interest but not the highest volume. This could be caused by traders closing near-term option positions, therefore lowering the open interest in the short-term cycles.
AAPL Volume and Open Interest
Let’s take a look at AAPL’s options to see if the same trend exists:
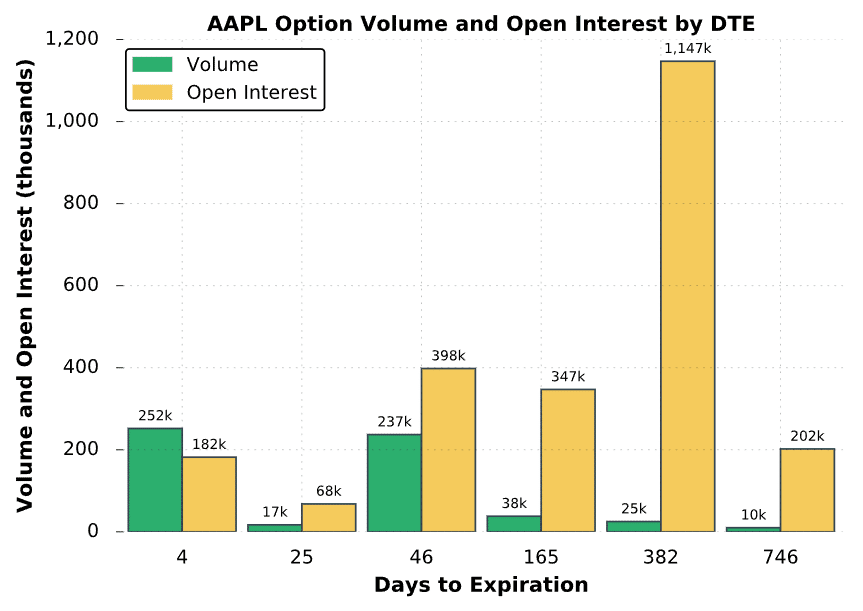
In the case of AAPL, the near-term expiration cycles have the highest amount of volume, but there is still a significant amount of open interest in the longer-term expiration cycles. Some possible explanations are that more traders have longer-term theories regarding AAPL, or that more traders are using longer-term cycles for stock replacement strategies.
In most stocks, the option volume and open interest will be greatest in the near-term option cycles (less than 100 days to expiration). Additionally, the options with strike prices near the stock price (at-the-money) tend to have the most overall trading activity.
Understanding these key points can help you stay in liquid products, which will benefit you by keeping your “hidden” trading costs low, as well as ensuring you’ll be able to exit a position more easily if it moves against you.
Next Lesson
Additional Resources



Thanks for the article! Just wondering – is there a lower bound for open interest and option volume? I’m looking at trading an option that has a volume of 6 and open interest of 12. Do you think this is too low?
Thanks!
Thanks for the question Lee, and I good one it is! Although there is no standard recommended range for open interest and volume, the option you are describing would probably be too illiquid for me. Some other factors go into play here, such as the option bid size, ask size, spread, and stock volume. Personally, I tend to trade options that have a volume and open interest of at least 100.
Hope this helps!
Mike