Last updated on April 8th, 2022 , 08:48 am
The popularity of exchange-traded funds (ETFs) has been skyrocketing in recent years. In 2003, there were only about 100 ETFs. Today, there are over 2,000.
Although mutual funds still contain a greater amount of assets when compared to ETFs (your 401k is probably all in mutual funds), ETFs are rapidly catching up.
In this article, projectfinance is going to explain why investors are flocking to ETFs and leaving traditional mutual funds in the dust. We will cover topics such as how ETFs are formed, what to look at specifically before purchasing an ETF (fund objective and fees), how an ETF maintains price stability, and why ETFs are superior to mutual funds.
First off, we are going to learn what exactly an ETF is. Although you probably know the broad strokes of how ETFs work, let’s paint the whole picture of an ETF with the painting analogy.
Highlights
- Exchange-traded funds (ETFs) pool together investors money to invest in baskets of securities.
- Unlike mutual funds, ETFs are traded on exchanges, allowing for greater liquidity.
- An ETFs prospective informs investors about important information such as the fund objective, expense ratio, relative price performance, and net asset value.
- “Authorized Participants” help to keep the fund’s NAV in line with the price of the underlying securities that compose it.
- Mutual funds have minimum investments; ETFs don’t. Mutual funds are illiquid; ETFs are generally very liquid; mutual funds often have two fees; ETFs have one.
What is an ETF?
ETF is an acronym for “exchange-traded fund”. An ETF falls under the ETP (exchange-traded product) umbrella .
Here is the textbook definition of an ETF.
Exchange-Traded Fund (ETF) Definition: An exchange-traded security that tracks one (or more) asset types, including indexes, sector’s and commodities.
Pretty simple, right? ETFs represent a bundle of securities that typically trade within an asset class on an exchange.
If you’re fortunate enough to have a 401k plan, you are probably familiar with mutual funds. If you were to look up the definition of a mutual fund, you would find a very similar definition with one very important exception: mutual funds are NOT traded on exchanges in the open market.
Having the ability to trade your security on exchanges is a huge bonus to investors. Just like shares of stock (AAPL or AMZN), you can purchase and sell ETFs in real-time and get filled at prices that you determine. Mutual funds? Not so much.
In order to understand the mechanics of ETFs, let’s start off with an analogy comparing an ETF to an investment in the art world.
Simple ETF Example: Painting Analogy

Since I’m writing this article in Figueres, Spain, I thought the art of Salvador Dali would be appropriate.
Let’s say that you were part of that small crowd that adores Dali. The above work (we’ll call it a painting) goes up for auction and sells for the insanely high price of 100 million dollars. You were at the auction, but you had only $500 to invest. Wouldn’t it be great if you could buy a piece of the painting (perhaps a tiny blotch of paint) for only $500?
That way, if, in 10 years, the painting were to double in value, you will make a profit of $500.
This “pooling” of funds is essentially what an ETF is. By combining your money with others, you can create enough wealth to buy complete artworks (or asset categories). So how would it work here?
“Creating” an ETF Fund
The creator (or seller) of the painting would create a “fund” and hold said painting in this fund. Next, the creator will issue 20 million shares to make up the whole 100 million dollar value of the fund.
Since the fund’s assets are worth 100 million, and the creator issued 20 million shares, then each share must be worth (100/20) $5/share.
This setup allows us to buy a share of this fund for only $5. We can then partake in the increase and decrease of the painting’s value over time.
But where do we do the buying and selling of our shares?
How about if we had a central location with brokers and traders that could help facilitate these transactions?
“Listing” an ETF Fund
Lastly, the fund’s creator would publicly list these $5 shares on a stock exchange.
After this step is complete, investors from around the world can buy shares of this fund, therefore giving everyone exposure to our 100 million dollar painting.
Since we wanted to invest $500 in the painting, how many shares were we able to buy?
Simply dividing our total investment ($500) by the per-share price ($5) gives us exactly 100 shares of the painting.
Now let’s say five years pass and that painting is now worth $200 million dollars. How much will our initial investment of $500 be worth?
Bingo. $1,000. We can then sell our shares back in the open market to lock in our profit.
An ETF operates just like this painting example; it is a method of dividing a portfolio of assets into numerous shares. By doing so, we allow investors of all different sizes to participate in the ownership of the fund’s assets.
Again, buying an ETF is very similar to buying shares of a company. If you were to buy shares of Apple (AAPL), you would have a small piece of ownership of the company. Instead of having ownership in a single company, an ETF allows us to own numerous companies (or any asset class type, like energy) through a single fund.
ETFs are therefore a great tool to democratize investing.
Real World ETF Example: S&P 500 ETF Trust (SPY)
If you understand the above painting analogy, you should have no problem with understanding how a real-world ETF works, such as State Street’s SPDR S&P 500 ETF Trust, or simply SPY.
The SPY ETF is the most popular ETF in the world. It trades more than any single company’s stock does in the world over a given day. Why?
Because of what it attempts to track- the S&P 500 index. This weighted index tracks the market capitalization of the 500 largest companies listed on stock exchanges in the United States.
In order to track this index, SPY, therefore, purchases ALL of the component stocks that make up the S&P 500 on a weighted basis.
So we can see why people would want to buy SPY now. Currently, you can purchase one share of SPY for $450. That means for $450, you get exposure to ALL companies within the S&P 500. That sounds like a great idea! But there are many ETFs that track the S&P 500; why is SPY so popular?
Let’s take a closer look at the details of SPY to find out why this particular fund is so popular.
What is the ETF “Fund Objective”?
The fund objective of an ETF is simply what the fund is trying to accomplish. Some examples would be a growth in investor value, income generation, or even a combination of both. In short, a fund wants to make us money; the fund objective tells us how they plan to go about this.
So in order to determine what SPY is trying to accomplish, where do we go? To the source of course!
All companies that list ETFs have a website dedicated to informing the public of important fund information, such as the fund objective, holdings, and relative performance. This is generally known as the fund “prospectus”. A prospectus informs investors about key fund details. You can find State Street’s SPY fund information here.
Let’s take a closer look at the details on this page next.
SPY Fund Objective
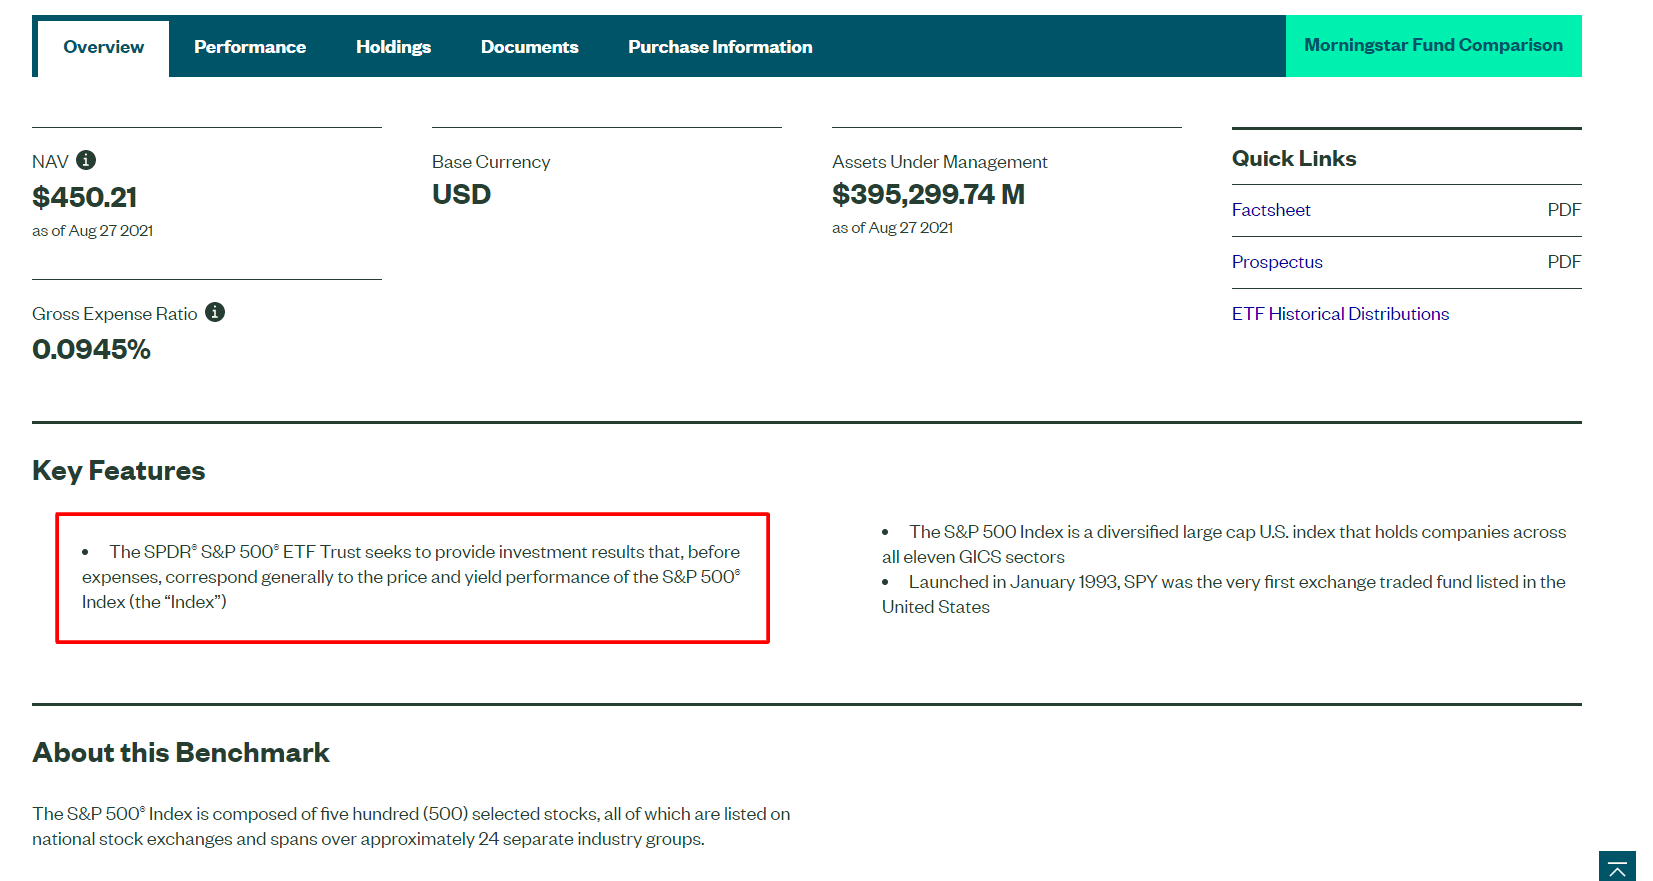
Below, you will find the fund objective of State Street’s SPY fund, listed here under “Key Features”.
SPY Fund Objective: The SPDR® S&P 500® ETF Trust seeks to provide investment results that, before expenses, correspond generally to the price and yield performance of the S&P 500® Index (the “Index”).
Pretty straightforward, right?
Also listed on this page is a VERY important feature that all ETFs have: a fee.
SPY Expense Ratio
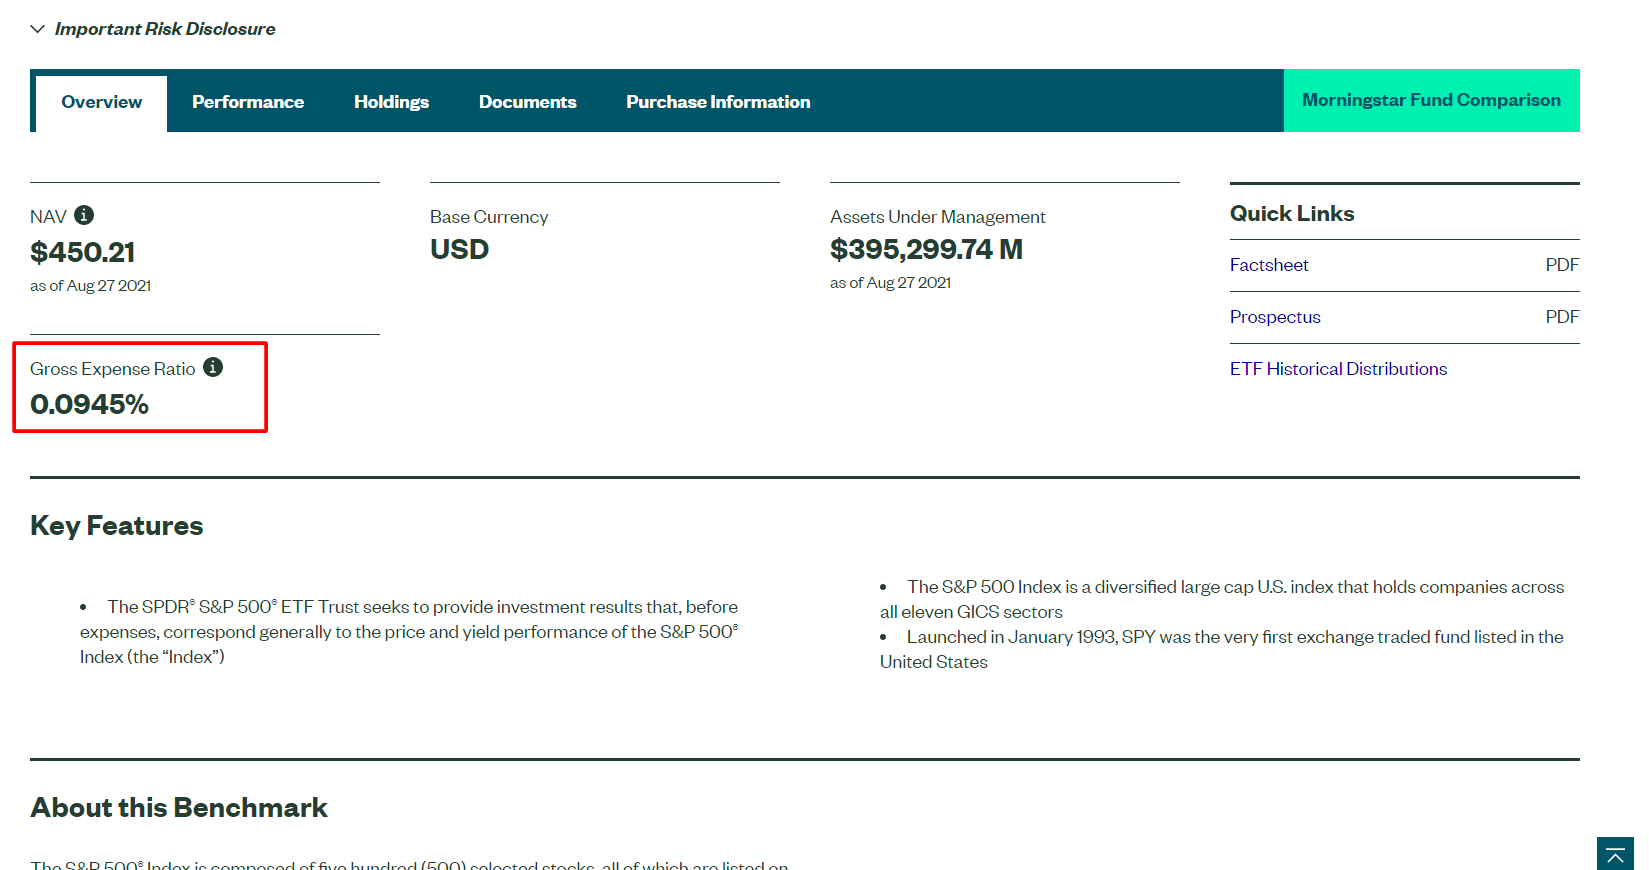
ETFs are not free. Some are incredibly cheap (like SPY), but they ALL must charge something. This isn’t, after all, charity. If somebody is going to not only purchase all 500 stocks within the S&P 500 but make sure the price continues to match that of the holdings, work must be performed.
For SPY, this fee is very low, coming in at around 0.09%.
What does this mean for us?
This means that if we invest 10k in SPY, we will pay only $9 in management fees for holding SPY over the course of the year.
A fee of about 0.09% (or 9 basis points) is incredibly low.
But what about the ETF’s relative performance? Its objective is to trace the S&P 500, but is it actually doing this? This brings us to our next point.
SPY ETF Price Performance
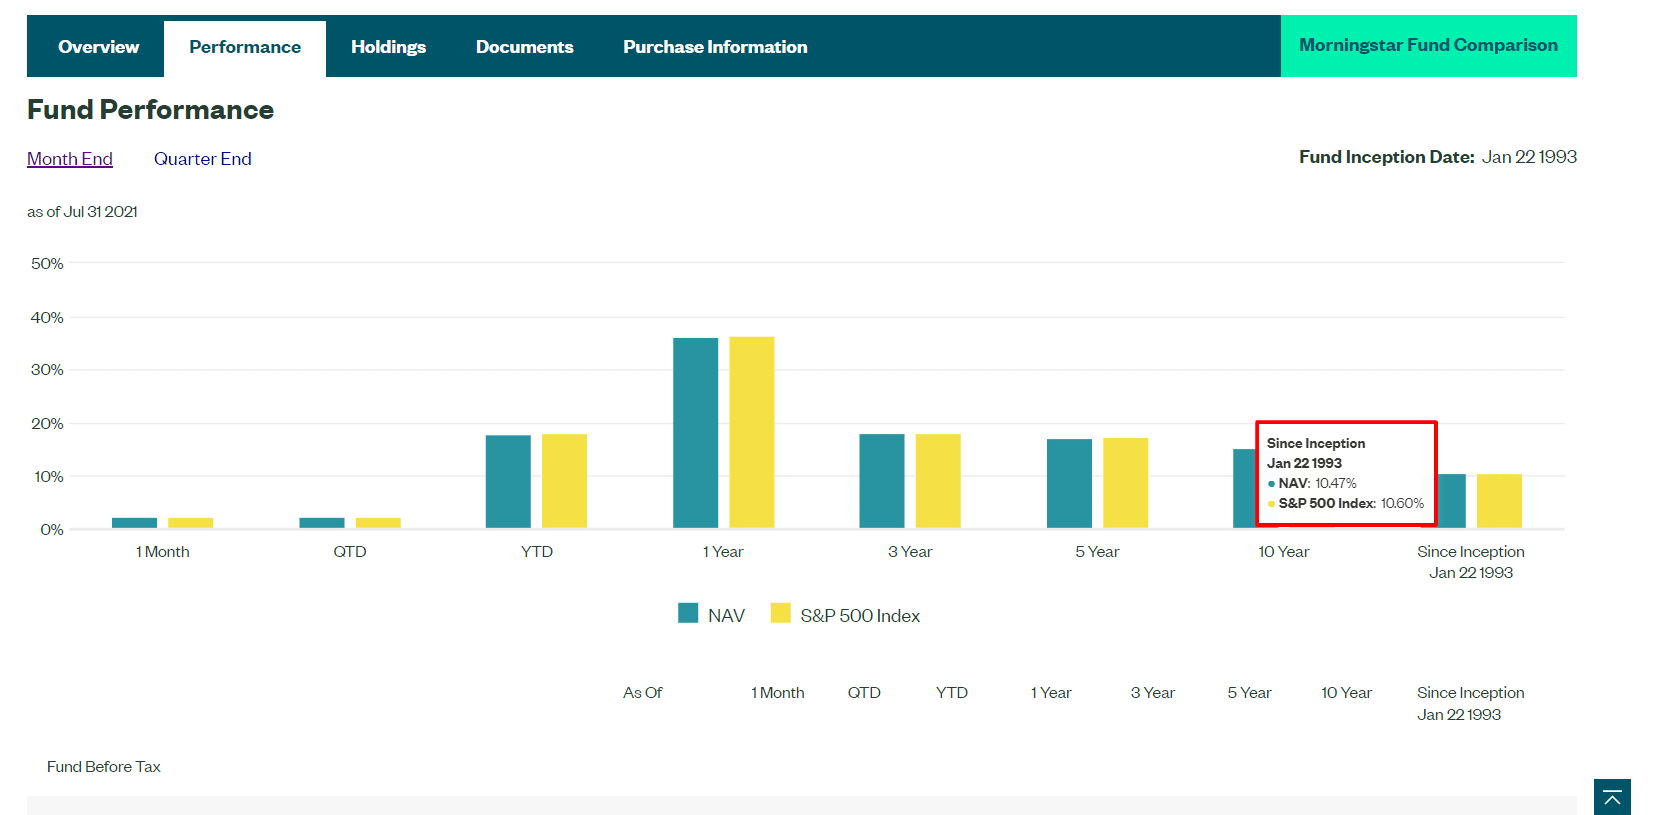
Also included on the fund’s information page is its relative performance.
We can see from the above image that SPY is doing a pretty darn good job of achieving its objective of tracking the S&P 500. The fund’s Net Asset Value (NAV) from inception has gained 10.47% per year compared to the S&P 500 Index NAV of 10.60%. Considering the work and money required to purchase the individual stocks composing the S&P on your own, that’s quite good indeed.
So what exactly does NAV mean? Let’s dive into that next.
Fund Net Asset Value (NAV) Explained
The below image shows us the NAV of SPY. Additionally, you will see the total number of shares outstanding and the funds assets under management (AUM).
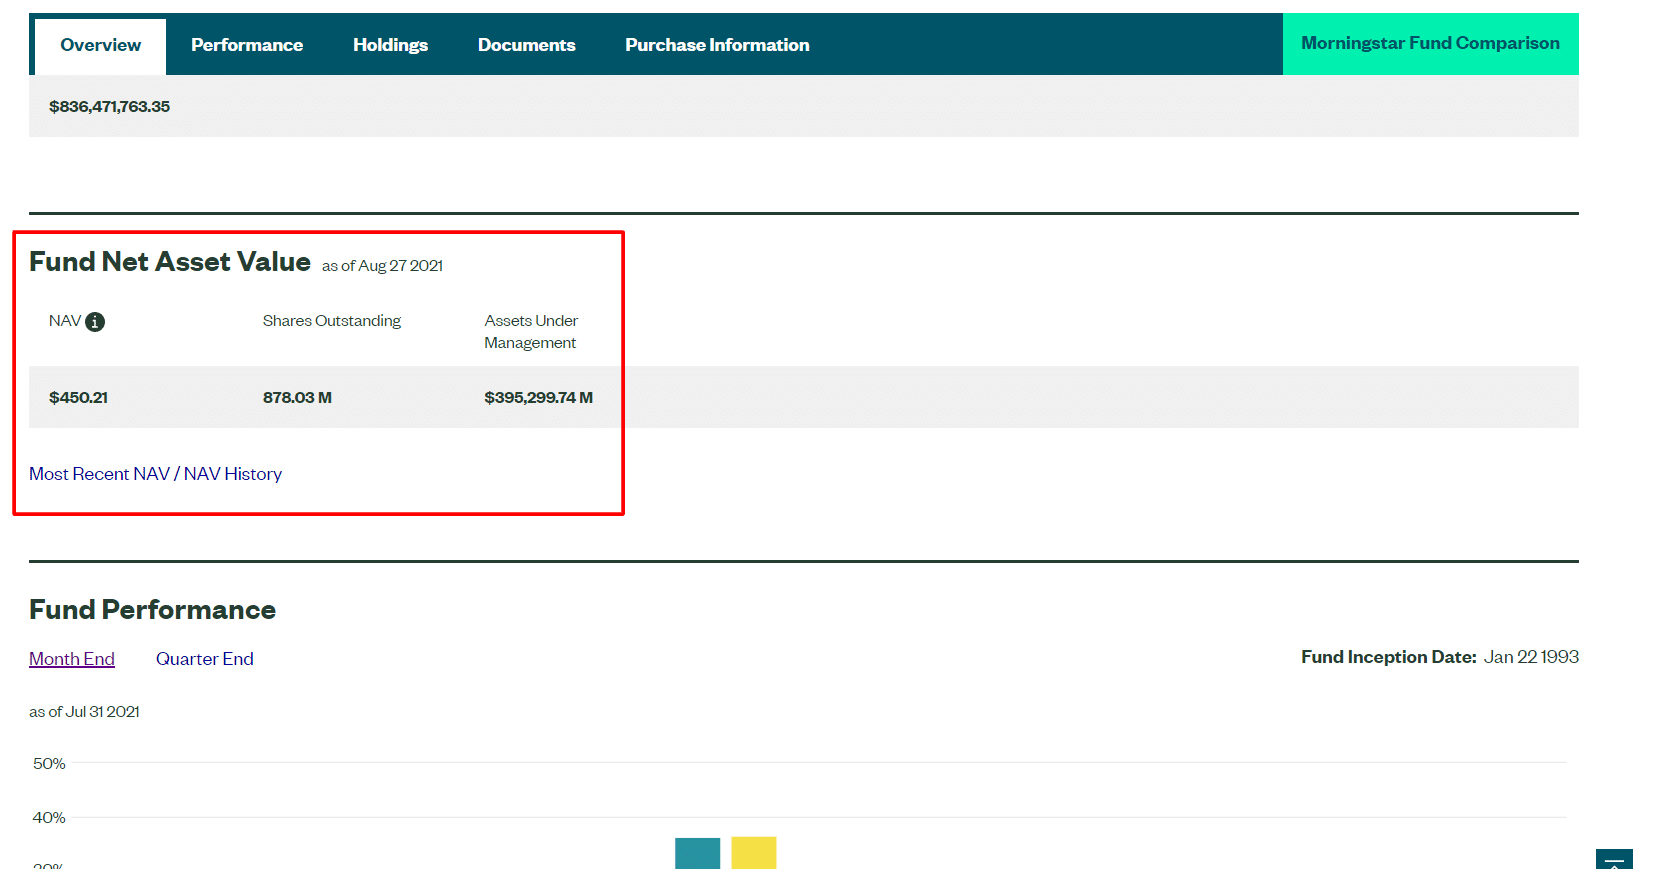
So what exactly is NAV? Let’s look at the formula first.
Net Asset Value = Fund’s Assets – Liabilities / Total Number of Shares.
In the SPY example, since there are no liabilities, we simply divide the fund’s assets by the total number of shares. This gives us a per-share price of about $450.
Now if you were to forgo the ETF option and buy every one of the stocks within the S&P 500 individually, you would need A LOT more than $445. Amazon (AMZN) alone would cost you over 3k!
Not All ETFs Are Created Equally
Before we move on, it is important to note that not all ETFs act as SPY. Many (if not most) ETFs underperform their benchmark and charge very high fees to do so.
The average ETF fee is 0.53%. Compared to SPY, this average annual fee is quite high; but when compared to the average annual mutual fund fee of 1.42%, this number is quite small indeed.
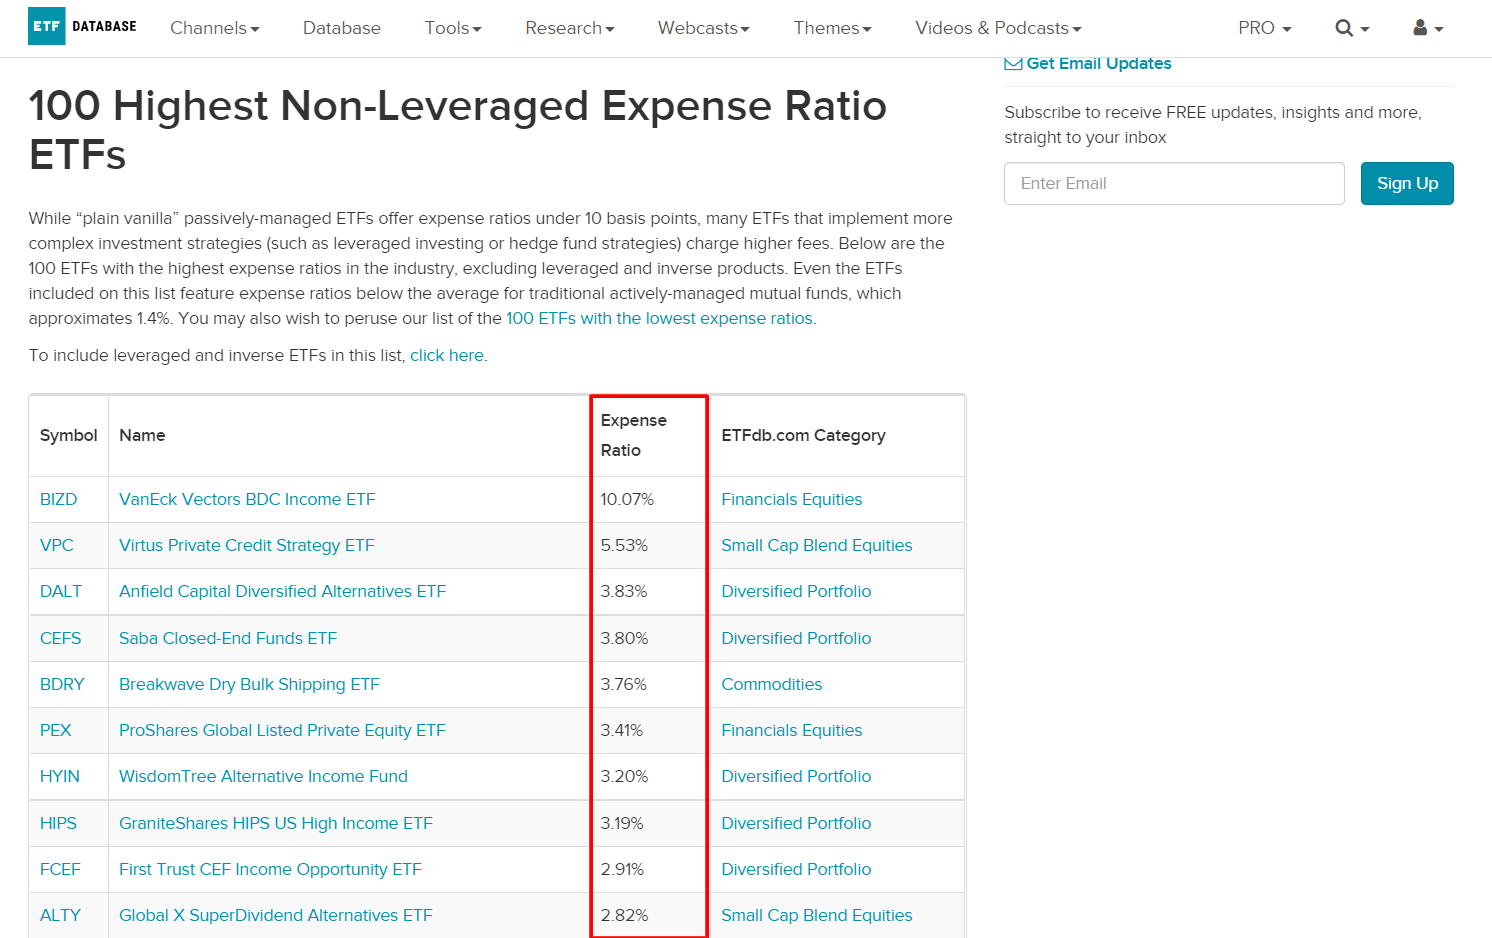
Take a look at a few of the high fee fund’s ETFDB lists below. These fees are ridiculously high and should be avoided in just about every single circumstance.
Let’s take a look at a few more examples of ETFs you should probably avoid.
Fear of Missing Out ETF (FOMO)
One ETF in particular that stands out for its exorbitantly high fees is the Fear of Missing Out (FOMO) ETF. This ETF tries to provide investors exposure to popular stocks, such as “meme” stocks. For exposure to only 76 stocks, a management fee of 0.90% seems quite high to me!
Leveraged ETFs: ProShares UltraPro Short QQQ (SQQQ)
Proshares SQQQ ETF is another fund that got our attention for its high fees. This ETF is known as a leveraged inverse ETF. SQQQ tracks the QQQ ETF inversely, at a ratio of 3:1. This means that, in a perfect world, this fund will increase in value by 3% on a day that the QQQ ETF decreases in value by 1%. On the contrary, if QQQ increases by 1% on a given day, SQQQ should decrease in value by 3%.
This ETF, therefore, requires a lot of manpower and trading. The result of this work performed is reflected in SQQQ’s expense ratio of 0.95%. This means that over the course of a year, this ETF is already down 1% in a constant market.
Though leveraged ETFs are used quite effectively by investment professionals for short-turn hedging, the general retail investor should probably avoid them. They are not designed for long-term investors. Why? Their ratio (whether it be 2:1 or 3:1) usually does not last in the long run. Volatile markets chip away at the NAV of leveraged ETFs.
If you’d like to learn more about the mechanics of leveraged ETFs, please check out our video below.
Leveraged ETFs for Beginners
To conclude this section, you should always go through the below checklist before investing in an ETF.
- Check the fund’s expense ratio.
- Make sure the fund actually tracks its benchmark.
- Make sure the funds NAV trades in line with its representative underlying products.
So you may have been wondering how it is possible that ETFs are able to correspond their price to match the holdings within. There is indeed a feature of ETFs that allows for their prices to correspond to their holdings. Let’s look at that next!
ETF Price Stability Explained
The Net Asset Value (NAV) is essentially the true share price that represents how much the value of the fund’s assets is divided by the number of shares. Because ETFs trade on public markets, the share price of ETFs can fluctuate with supply and demand. Shares of ETFs therefore can sometimes trade at a discount, or premium, to the actual value of the fund’s holdings.
So what keeps the ETF shares in line with the NAV?
Authorized Participants
Traders called “authorized participants” are called upon to help level out the price of an ETF when its share price deviates from its NAV. Here’s the definition of an AP.
Authorized Participant Definition: An organization that has the ability to change the supply of ETF shares, thus providing liquidity for their representative fund.
APs, therefore, have a relationship with an ETF issuer. APs are chosen at an ETFs launch. Their job is to keep the share price in line with the NAV. Whenever a premium or discount is present, they step in and correct it.
Authorized Participant Example: SPDR S&P 500 ETF (SPY)
Let’s say SPY shares are trading at a premium to their Net Asset Value (NAV). Can you guess how the Authorized Participant (AP) would correct this?
An AP would go out into the market and purchase all stocks that SPY holds (the S&P 500). By doing so, the AP increases the price of their ETF. Sounds like a lot of work!
In return for providing this service, the AP receives shares of the ETF (SPY in this case) from the issuer. The AP will then sell these shares in the open market. These two actions combined help to chip away at the premium and bring the NAV in line.
If the ETF is trading at a discount, the AP will sell shares of the underlying and buy up the ETF: just the opposite as above.
So, in short, the AP battles price imbalance by:
- Buying/selling the underlying shares
- Buying/selling the ETF itself.
These actions combined are often enough to stabilize an ETF price. APs aren’t the only ones to profit from price imbalances; if traders see an imbalance in price, they too can take advantage by participating in arbitrage.
Why You Should Avoid Mutual Funds
So hopefully by now, you’ll have a good idea of why investing in ETFs makes more financial sense than investing in mutual funds. Let’s really drive this home now.
1. Mutual Funds Typically Have Minimum Investments
For most mutual funds, there is a minimum initial investment. This often ranges between $500 and $5,000.
ETFs have no minimums. Ever. You’ll only ever need to pay the share price. And with fractional shares, you can even avoid this.
2. Mutual Funds Are Illiquid
Liquidity allows us to quickly buy and sell a security with minimal loss. Think of trading Apple (AAPL) stock. You can buy it and sell it on an exchange through your broker immediately for almost the same exact price. You also have no idea as to the bid-ask spread.
Mutual funds do NOT TRADE on public stock exchanges. You can’t buy and sell them whenever you want. Usually, you can only trade them once per day. You will have no idea at what price you will get filled. Typically, the price is the last trading price of the day. This doesn’t help you much if you want to sell a fund first thing in the morning before the market tanks 2%!
Additionally, some mutual funds have a “lock-in” period. This means you can’t sell the funds until a certain amount of time has passed.
In addition to being traded on exchanges, ETFs have no lock-in periods.
3. Mutual Funds Have Higher Fees
Mutual funds actually have 2 fees!
1.) Expense Ratio
Like ETFs, mutual funds have an expense ratio. However, on a whole, mutual fund fees are much higher than ETF fees.
2.) “Load” Fees
Mutual Funds have “load” fees; ETFs don’t.
There can be both “front-end” and “back-end” fees for mutual funds. This means you have to pay a flat percentage to sometimes both enter and exit a mutual fund.
ETFs have no load fees. Ever.
Hopefully, you now realize there is seldom a case when a mutual fund beats an ETF.
So what are some of the more popular ETFs? Let’s take a look at a few next.
Popular ETFs in Each Asset Class
Below you will find a chart illustrating the ETFs that have had the most inflows of funds over the past year.
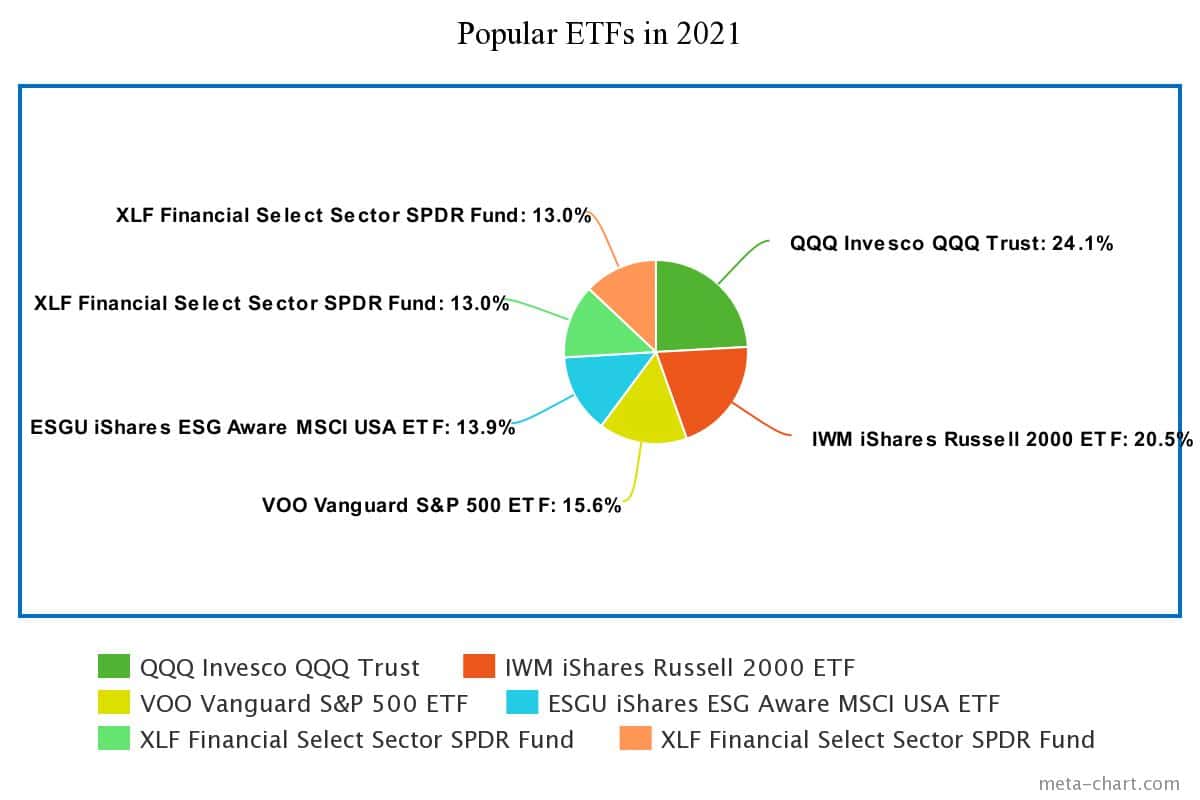
ETFs are not limited to only stocks; they cover a wide array of asset classes. Here are some of the more popular ETFs across various asset classes:
- Commodity ETFs
- Stock ETFs
- Bond ETFs
More on ETFs
If you’d like to read more on specific ETFs, please check out our articles below!

