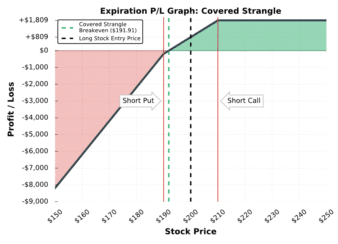
Options Trading How the Covered Strangle Option Strategy Works (Guide W/ Visuals) Read More » February 10, 2022
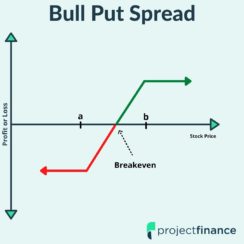
Options Trading Bull Put Spread Example W/ Visuals – The Ultimate Guide Read More » February 10, 2022
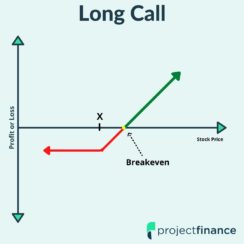
Options Trading Long Call Option Strategy for Beginners – Guide w/ Visuals Read More » February 10, 2022