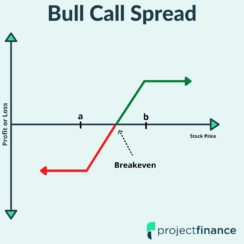
Options Trading Bull Call Spread Explained – The Ultimate Guide w/ Visuals Read More » March 24, 2022
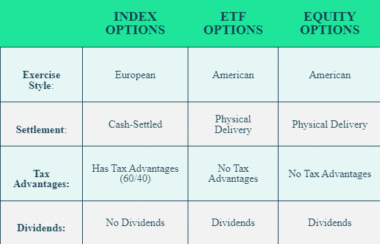
Options Trading Index Options vs Equity Options vs ETF Options w/ Visuals Read More » February 11, 2022
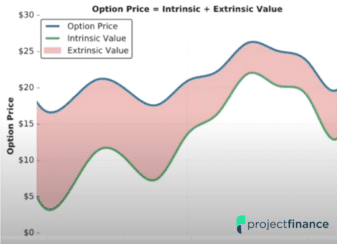
Options Trading Intrinsic and Extrinsic Value in Options Trading Explained Read More » April 29, 2022