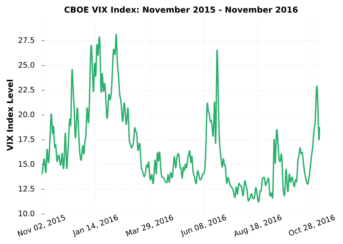
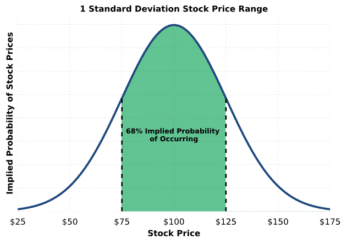
Options Trading Implied Volatility Explained (Options Guide w/ Visuals) Read More » February 10, 2022
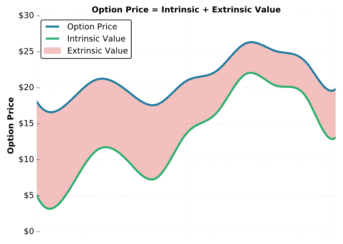
Options Trading Intrinsic & Extrinsic Value Explained (Options Trading) Read More » February 10, 2022
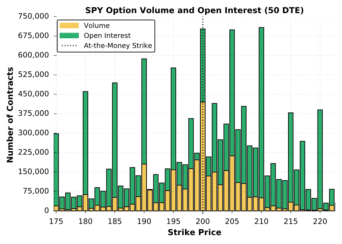
Options Trading What is an Option’s Strike Price? | Options Guide w/ Visuals Read More » February 22, 2022