?> Mike Martin

Call and Put Options at Expiration

Time and Money

Where do options go when they expire? If an option has no value, do you need to take any action? What will happen if you do not sell an in-the-money option by expiration?

Projectfinance has answers to all of your questions. In this article, we will explore the various outcomes of holding call and put options through expiration. 

   Highlights

  • Out-of-the-money options “expire worthless” at expiration; no action is required

  • At-the-money options pose significant risks to traders in the time leading up to expiration. Best practice is to buy back short options before expiration to avoid the unnecessary stock risk 

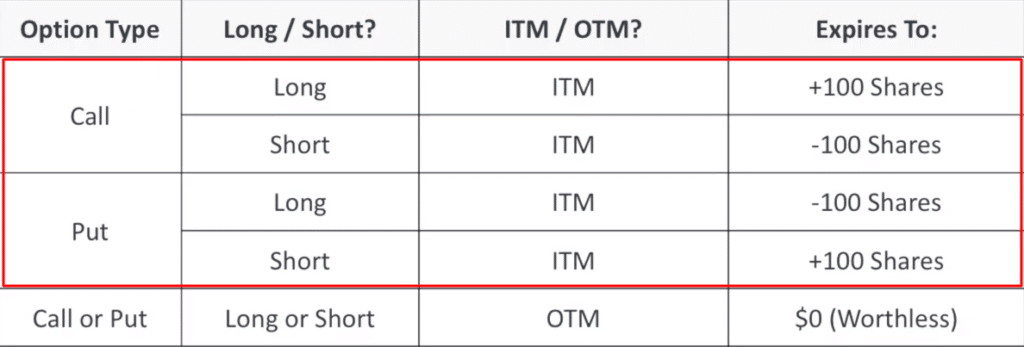
  • In-the-money options will be assigned/exercised at expiration

  • In-the-money long calls/puts will settle to long/short stock position. In-the-money short calls/puts will settle to short/long stock positions. 

Holding certain options through expiration can introduce traders to unnecessary risks. Out-of-the-money options, however, pose no risk. Let’s start off with these types of options first!

Out-Of-The-Money Options at Expiration

out of the money options

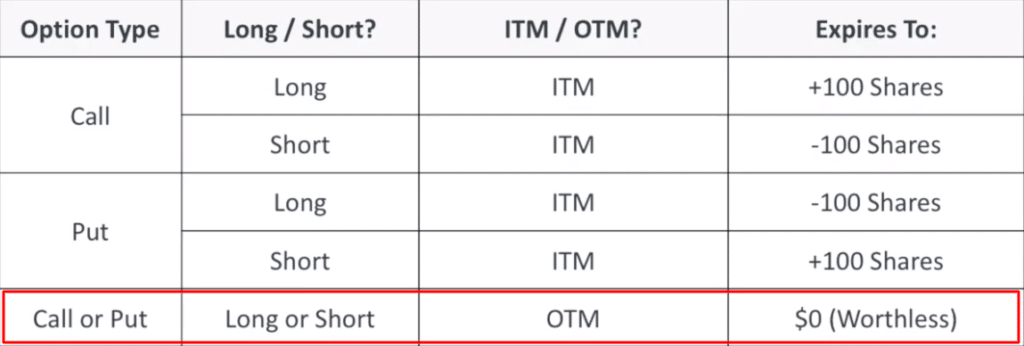
If you are either long or short an options contract that is out-of-the money at expiration, you will generally have nothing to worry about. No action is required. Zip. Nada. Zilch. 

Why? It makes zero financial sense for the owner of a long call or long put to exercise their right to buy/sell a stock (or ETF, or any security) if the current market price of that stock is more favorable than the strike price of your option. 

Out-Of-The-Money Option at Expiration Example

For example, let’s say you own a 160 strike price call on AAPL. In the minutes leading up to expiration, AAPL is trading at $150 a share. 

If you were to exercise your call contract, you would purchase 100 shares of AAPL at $160/share. Why on earth would you do this? You wouldn’t’. The best decision you can make is to do nothing. 

Consequently, this means that if you are short an out-of-the-money option going into expiration, no action is required.

No long party in their right mind would exercise their call at this strike price. Therefore, your short position has no assignment risk. 

But what if someone does exercise their option at this strike price? Rarely, this occurs. 

Long option holders (of American-style options) have the right to exercise their option at any time. So let’s say they do this with an out-of-the-money option. This is a good thing for you! You’ll either buy (for short puts assigned) or sell (for short calls assigned) the underlying stock at a better price! Make sure to send them a thank-you note.

But 99.99% of the time, these options will “expire worthless”. The long party will lose the full premium; the short party will make the full premium.

Out-Of-The-Money Calls vs Puts at Expiration

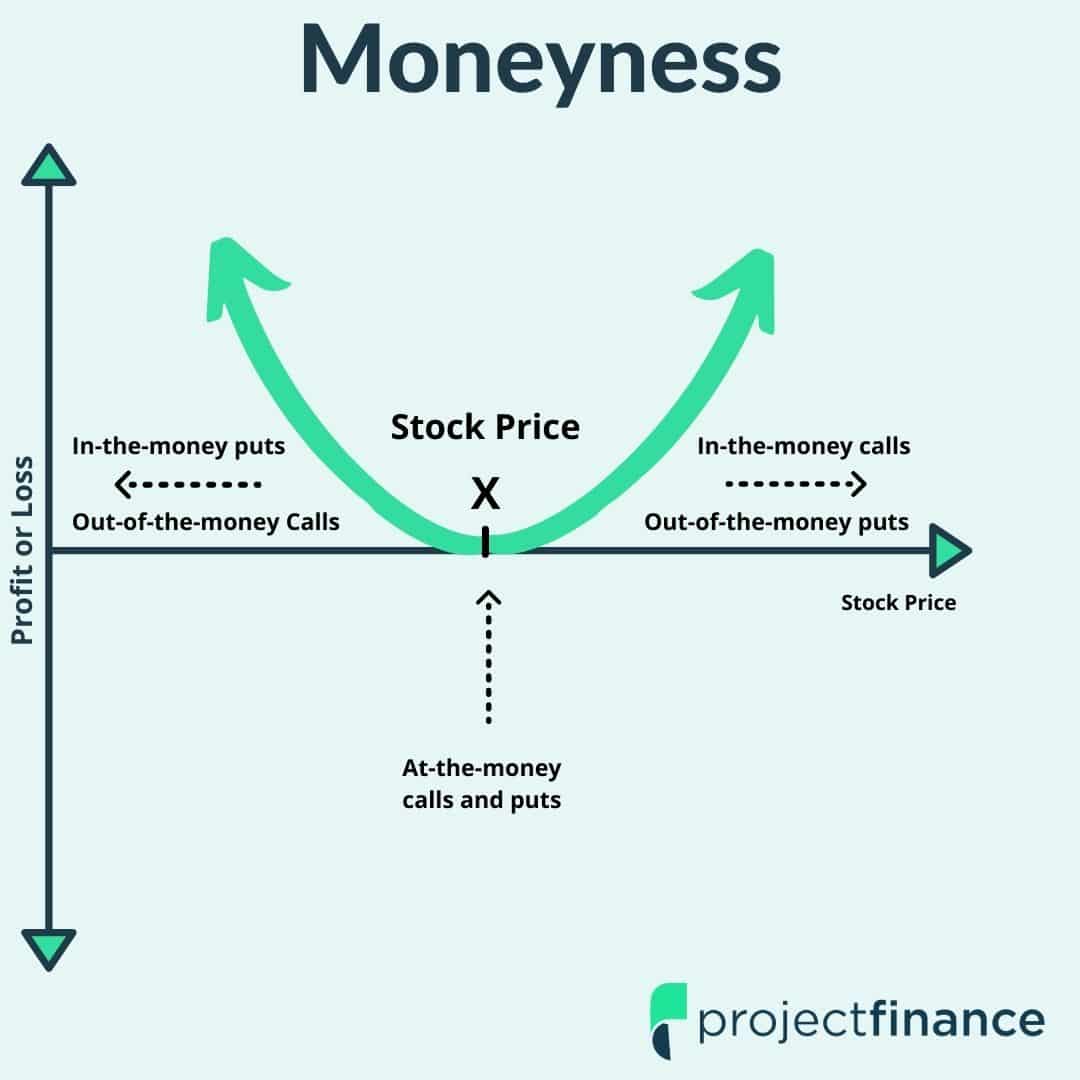
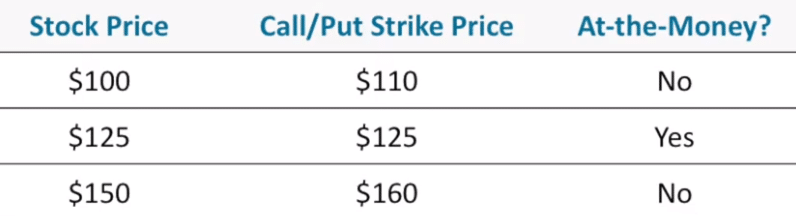
In order to determine whether or not your option is “out-of-the-money”, understanding moneyness helps. A cheat is provided below. However, if you’d like to study up on moneyness, read our article, “Option Moneyness Explained.”

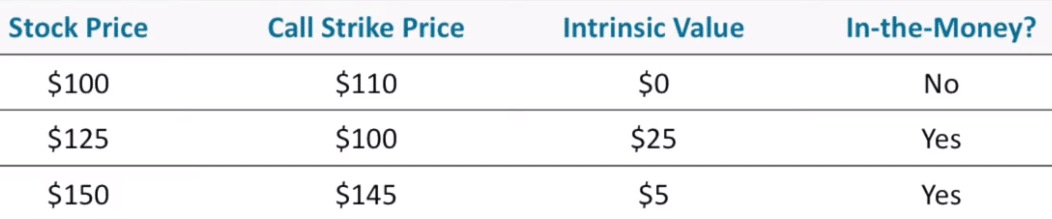
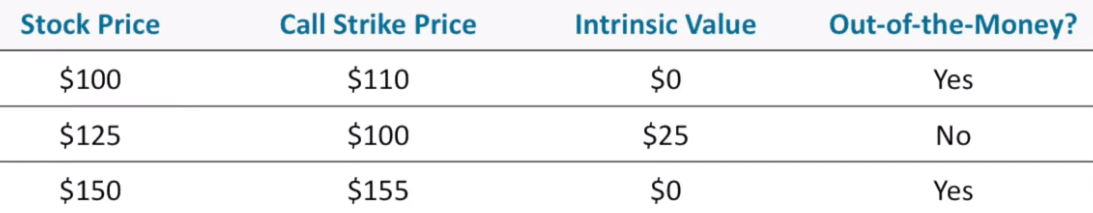
  • Call options expire worthless when the strike price is higher than the price of the stock/security at expiration
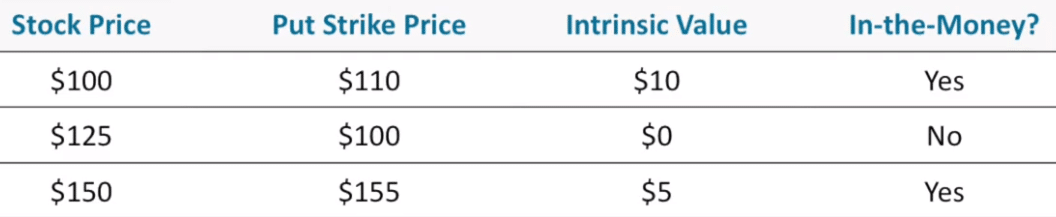
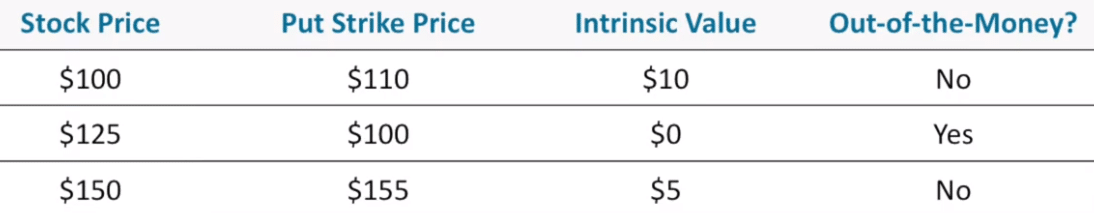
  • Put options expire worthless whe the strike price is lower than the price of the stock/security at expiration

Worthless Options Post Expiration

So what exactly happens to your out-of-the-money options at expiration? We said they “expire worthless”, but where do they go?

They simply cease to exist. They are no more. The contract has expired. They are yesterday’s news. 

Ok. So out-of-the-money options are easy.

But what if, at the moments leading up to expiration, the stock price is hovering right around your strike price?

At-The-Money Options at Expiration

With at-the-money options, things aren’t so cut and dry. To better understand what could happen to these options at expiration, let’s return to our AAPL trade. 

At-The-Money Option at Expiration Example

We are long the 150 AAPL call. In the minutes leading up to expiration, AAPL is trading at $149.89.

Our option is technically “out-of-the-money”, but what happens if AAPL shoots up by a quarter in the last second of trading?

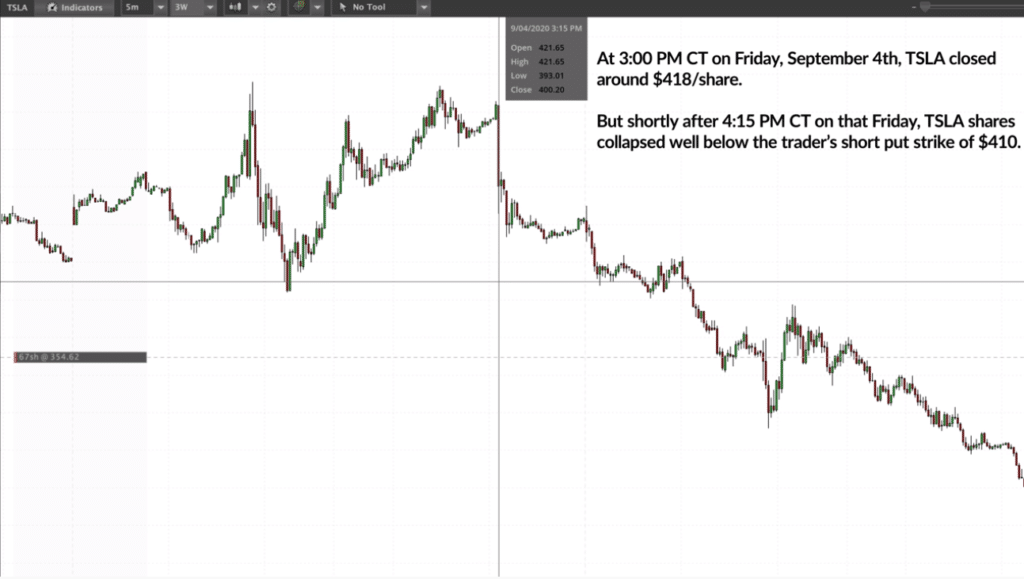
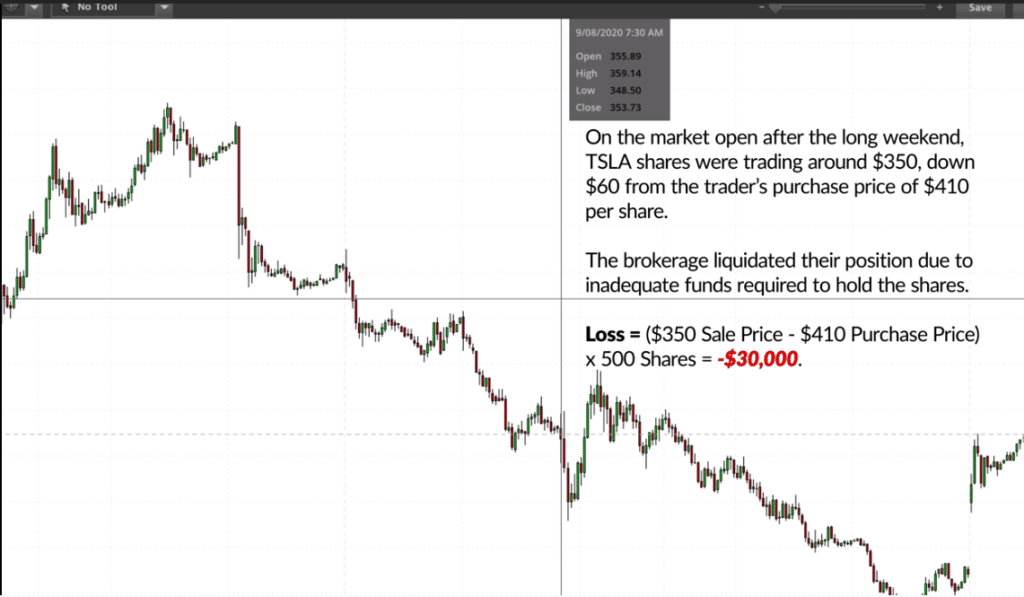
If you’re long this option, your broker will automatically exercise your call if it is in-the-money post expiration (the same thing would happen for puts). However, you can contact your broker and request your long not be exercised. You need a lot more money to hold 100 shares of AAPL stock (15k right now) than your call option.

Now, what about if instead of being long, you were short this AAPL call option? Well, you’d be in a tight spot. There is no guarantee that an option only slightly in-the-money will be exercised, so offsetting the soon-to-be stock with stock now isn’t a sure hedge.  

At-The-Money Options and Pin Rsk

What do you do? Nothing. This is called “Pin Risk” (Investopedia) and it’s very real.

Pin Risk Definition: In options trading, pin risk occurs when the strike price of an option is trading in a close range with the underlying stock/security price as expiration approaches. 

I’ve been here before. It sucks. If you have a large position, it could wipe you out. 

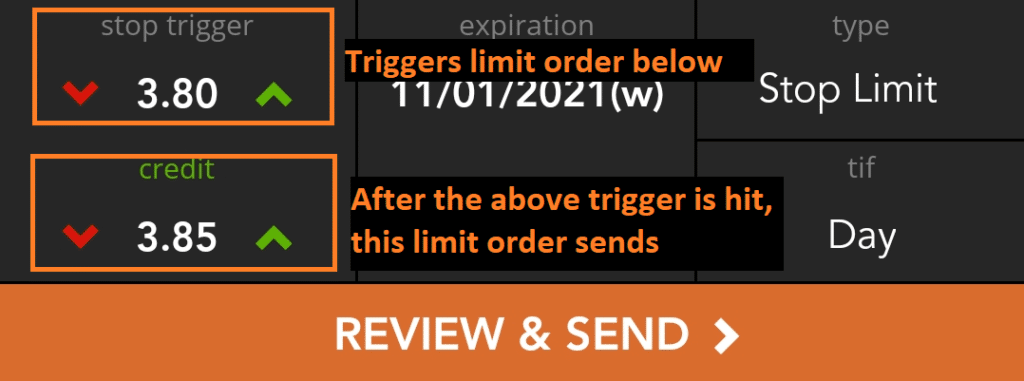
It’s always best practice to buy back short positions that have even the remotest chance of being assigned before expiration. It’ll cost you pennies, and could save you thousands.

On Wall Street, bears make money, bulls make money, but pigs get slaughtered!

So what happens if your long does indeed get exercised or your short gets assigned?

In-The-Money Options at Expiration

If your option is in-the-money at expiration, you may be in trouble. 

Again, in order to understand whether or not your options position is in danger of being assigned, understanding moneyness is imperative. It’s simple stuff, truly. American-options that are in-the-money at expiration will be exercised/assigned. 

So what does this mean? It depends on the type of option. 

In-The-Money Call Options at Expiration

  • Long call options that are in-the-money at expiration will be exercised, and (usually) 100 long shares of the stock/security per option contract will appear in your account, usually within one day.
  • Short call options that are in-the-money at expiration will be assigned, and (usually) 100 short shares of the stock/security per option contract will appear in your account, usually within one day

In-The Money Put Options at Expiration

  • Long put options that are in-the-money at expiration will be exercised, and (usually) 100 short shares of the stock/security per option contract will appear in your account, usually within one day.
  • Short put options that are in-the-money at expiration will be assigned, and (usually) 100 long shares of the stock/security per option contract will appear in your account, usually within one day.

American vs European Style Options

Most options on stock and ETF products are American-style. This means they are settled in stock. AAPL options, like most equities, are settled American-style. 

But not all options are American Style. Some options are “European Style”. In addition to not allowing for early exercise/assignment, European options are settled in cash.

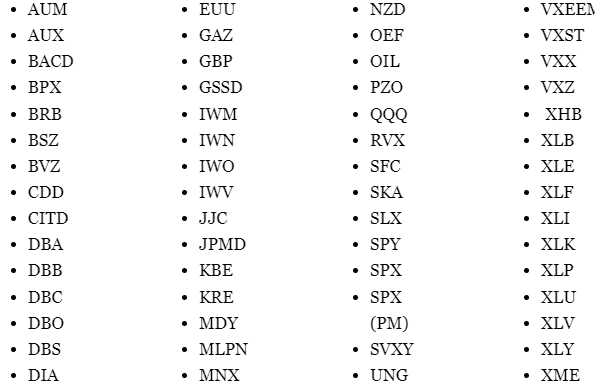
Index Options (like SPX, NDX and RUT) are European Style, and thus cash-settled.

Cash-Settled Definition: In cash-settled products, there is no physical delivery (stock) after expiration for in-the-money options. Instead, a transfer of cash occurs.

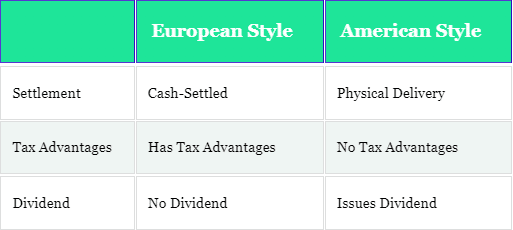
Check out the below table for a comparison of these two types of options. For a more in-depth review (like understanding the taxation difference), check out our article comparing SPX to SPY options (European style vs American style).

European Style
American Style
Settlement
Cash-Settled
Physical Delivery
Tax Advantages
Has Tax Advantages
No Tax Advantages
Dividend
No Dividend
Issues Dividend
European vs American style options

European Style Options Explained

European style options (Investopedia) don’t have the huge stock risk that comes with American style options. If you’re trading SPX and your short call option is in the money by $1 at expiration, you’ll simply be required to transfer that cash difference to the long party at expiration.

Professional traders love trading index options for this reason. In addition to there being no dividend risk, European options shield short options traders from early assignment risk. Additionally, pin risk does not involve that huge monetary transfer of stock. A simple and relatively small transfer of cash settles these options. It doesn’t matter where SPX opens the next day, your position settles off the closing price at expiration.

Final Word

In order to understand the repercussions of expiration on your options, you must understand moneyness. In-the-money American-style options introduce investors to potentially huge monetary risks. 

For a deeper understanding of options trading, please check out our articles below!

Next Lesson

Option Moneyness: In The Money, At The Money and Out Of The Money

option moneyness chart calls and puts

All call and put options contracts exist in one one three “moneyness” states: in-the-money (ITM), at-the-money (ATM), or out-of-the-money (OTM).

To truly understand moneyness, we must first understand the difference between intrinsic value and extrinsic value. 

   Highlights

  • Option “Moneyness” refers to the relationship between an option’s strike price and the current stock price.

  • In-the-money options have intrinsic value. For calls, the strike price of these options resides below the current stock price. For puts, in-the-money options reside above the current stock price.

  • At-the-money options refer to strike prices that are trading at (or very close to) the current stock price.

  • Out-of-the-money options have zero intrinsic value. Calls are out-of-the-money if the strike price is above the current stock price. Put are out-of-the-money when the strike price is below the current stock price.

Intrinsic Value Explained

The price of an options contract consists entirely of intrinsic and/or extrinsic value.

Intrinsic value is simply how much value an option has on its own. In other words, this is the value an option would have if it were exercised at any given moment in time. Intrinsic value discounts time and implied volatility.

  • For call options, intrinsic value exists when the strike price of the option is trading below the current stock/security price. The amount of intrinsic value in a call option is calculated by subtracting the strike price from the current stock/security price. 

  • For put options, intrinsic value exists when the strike price of the option is trading above the current stock/security price. The amount of intrinsic value in a put option is calculated by subtracting the underlying stock price from the options strike price.

If the strike price of a call option is trading above the current stock price, no intrinsic value exists. Likewise, if the strike price of a put option is trading below the current stock/security price, no intrinsic value exists.

Extrinsic Value Explained

In options trading, extrinsic value represents the portion of an options price that is not intrinsic value. It is everything that is “left over”. Both implied volatility and time affect the extrinsic value of an option. 

  • If the strike price of a call option is above the stock price, it will have no intrinsic value. Since the value of an option must be entirely intrinsic and/or extrinsic value, we can deduce the price of these options must consist entirely of extrinsic value.

  • If the strike price of a put option is below the current stock price, this option will have no intrinsic value. Therefore (like call options), its entire premium must consist entirely of extrinsic value.

Determining how much intrinsic and/or extrinsic value exists in an option depends on where the stock is trading. These proportions can be in constant flux with the market, as illustrated in the 105 strike price call option graph below. 

Extrinsic and Intrinsic Value Changing

Intrinsic vs Extrinsic value chart

Before we move on, let’s break down intrinsic and extrinsic value in an Apple call example. 

AAPL Call Option Example

Stock Price: $150

Call Strike Price: 149

Call Option Price: $3

Extrinsic Value: $2

Intrinsic Value: $1

So now that you understand how these values work, understanding moneyness will be a cinch!

In-The-Money (ITM) Options Explained

If the strike price of a call option is below the stock price, the call option will be in-the-money. The depth of an options moneyness will determine its intrinsic value.

Call Options Chain: In-The-Money?

If the strike price of a put option is above the current stock price, that put option will be in-the-money. Like that of call options, the amount a put option is in-the-money by will determine its intrinsic value.

Put Options Chain: In-The-Money?

At-The-Money (ATM) Options Explained

At-the-money options have a strike price that is trading at or very near the current stock price. Though technically just about all options will be in or out-of-the-money, this term is used as a generalization. If an option is a few cents in the money, though technically “in-the-money”, most traders will refer to the option as at-the-money.

Put & Call Options Chain: At-The-Money?

At-The-Money Option Chain

Out-Of-The-Money (OTM) Options Explained

Out-of-the-money options are composed completely of extrinsic value; they have zero intrinsic value.

A call option is “out-of-the-money” when the strike price is above the current stock price.

Call Options Chain: Out-Of-The-Money?

Out-Of-The-Money Calls

A put option is “out-of-the-money” when the strike price is below the current stock price. 

Put Options Chain: Out-Of-The-Money?

Out-Of-The-Money Puts

Final Word

Understanding an options moneyness is simple. After determining the type of option (call or put), simply locate where the strike price of that option is in relation to the stock price. That’s it!

Not considering volatility and time, if an option has value on its own, it will be in-the-money. If an option has none of this “intrinsic” value, it will be out-of-the-money. 

Next Lesson

Option Greeks Explained: Delta, Gamma, Theta & Vega

Greek Pillars

   Highlights

  • The “Greeks” help traders predict how options will respond to various market changes in the underlying

  • Delta and gamma predict option price movement in response to changes in the underlying price

  • Theta tells traders how much extrinsic value an option will shed after one day, with all other conditions remaining constant

  • Vega predicts how an options price will respond to changes in implied volatility

  • Most trading platforms can be laid out to include the Greeks

There are few things more daunting to the amateur options trader than the series of complex mathematical equations dubbed the Greeks. Just trying to wrap your head around these risk-management equations is panic-inducing. However, if you want to become a serious options trader, you must understand them.

The good news? You do not need an advanced degree from MIT to equate and understand these helpful market measures. On almost all trading platforms, the computations are done for us. All we need to do is interpret their meanings, which we will accomplish in this article. 

Today we will focus on the big four Greeks: delta, gamma, theta, and vega

Delta and gamma work together, measuring how options respond to changes in the underlying price. Theta tells us how much an option changes in response to the passage of time. Lastly, vega tells us how sensitive an option is to changes in the implied volatility of the underlying. 

Possessing a basic understanding of these absolutely vital risk-management tools will surely pay your portfolio dividends in the future. Let’s get started!

The Option Greeks and Time

Perhaps the most important thing to know about the Greeks is that they are forward-looking. Think of them as little-time travelers, peering into the future and reporting back to you what could happen under various circumstances. 

The most effective education happens when the student wants to learn. Therefore, before we continue, let’s plant that seed. 

If you’ve ever been long a call option, haven’t you wondered why that option reacts the way it does to changes in stock price? 

I have talked to many long-call holders on the phone who were a little more than discouraged to discover their option didn’t rise in value as much as they thought it would when the underlying stock rallied. 

If only there was a way to tell ahead of time what would happen to an options price if the stock shot up by a dollar…oh, but there is!

1. Option Delta Explained

Enter delta. The delta of an option tells us how an option will react to a change in stock price before that price change happens. Pretty cool, right?

Δ Option Delta Definition: In mathematics, an uppercase delta represents the change in a quantity. In options trading, the delta of a position is expressed as a ratio of change. This ratio tells us how much an options position is expected to change in value with a corresponding $1 move in the underlying security. 

Option Delta in Calls and Puts

The value of an options delta will depend on the type of option:

  • All call options will have a delta value between 0 and +1. 
  • All put options will have a delta value between 0 and -1.

Why is the delta negative for put options? Put options have an inverse relationship with a stock price; when the stock goes up, the value of the put goes down.

The delta of an option simply tells us how the price of an option will change if the underlying stock price were to immediately rise or fall by a dollar.

If you were long a call, and that call had a delta of 0.34, that option would increase in value by 34 cents if the underlying stock were to go up a dollar. Conversely, the option would fall by 34 cents if the underlying stock fell by a dollar. 

Pretty simple stuff, right? Things can get a bit more complicated when you get into delta hedging, but we’ll save that for another lesson.

Let’s look at an example now on a truncated options chain.

AAPL Option Delta Example

Type Strike Price Delta +$1 Share Price Affect -$1 Share Price Affect

Call

147

3.25

.64

3.89

2.61

Call

148

2.63

.52

3.15

2.11

Call

149

2.11

.42

2.60

1.62

Where AAPL is trading at $148.20

The above options chain shows us how an increase/decrease in the price of Apple (AAPL) by $1 affects various option prices after contributing for delta. 

If you want to determine how much an option will increase or decrease in response to a $1 move in the underlying, just add/subtract the delta from the option’s current price. Voila. That’s it. 

Delta and Moneyness

In the above table, AAPL stock is trading at $148.20. That means that the 147 call is in-the-money, the 148 call is (pretty close to) at-the-money and the 149 call is out-of-the-money. 

We can see the 147 call has the highest delta. The delta of in-the-money call options approaches a positive 1 as expiration nears.

The 149 call has the lowest delta. The delta of out-of-the-money calls approaches zero as expirations near.

At-the-money-options (the 148 call) tend to have a delta of around 0.50 over their life. Ultimately, just about all options will close in or out-of-the-money. 

The further we go out-of-the-money, the less effect stock price movement has on our options delta. If you’re long options, decreasing delta is bad news. However, if you’re short options, low deltas are a good thing. 

Before we move on, take a moment to study the below graph, which shows the relationship between option delta and strike price (the dashed vertical line represents the current stock price, which is also where at-the-money options reside).

Delta vs Strike Price

Delta and Moneyness Odds

Delta has another function; it also tells us the odds an option has of expiring in-the-money.

Take a look at the 149 call in our AAPL option chain above. The delta for this option is 0.42. In addition to telling us this option will increase in value by 0.42 if the stock were to go up by a dollar, it also represents the odds that an option has of expiring in-the-money.  

The 149 call has a 42% chance of being in-the-money at expiration. The 148 call has a 52% chance of expiring in-the-money. 

Bear in mind these numbers are in constant flux with the underlying. 

How Delta Mimics Shares of Stock

We’re not quite done with delta yet. I hope you’re beginning to see why it is the first Greek on this list! It is the most important by far.

The delta of a position can also tell us “how many” shares of stock an option trades like. If our delta is 0.20, our option will mimic the profit/loss on approximately 20 shares of stock. If an option has a delta of 1 (as many deep-in-the-money options have) that option will trade like 100 shares of stock.

Option Delta Summary

Before we move on to our next Greek, let’s sum up all we’ve learned about delta.

  1. The delta of an options position tells us how much the value of that particular option will fluctuate with a corresponding $1 move in the stock price.
  2. The delta of an option represents the odds that a particular option has of expiring in the money. A delta of 0.30 has a thirty percent chance of expiring in-the-money.
  3. Delta also tells us how many shares of stock our option “trades like”. In a profit/loss profile, a delta of +0.50 will trade similar to 50 shares of the underlying security.

To learn more about delta, please check out our video below!

2. Option Gamma Explained

Gamma takes a look at delta and then goes a step further. You can’t understand gamma without first understanding delta, so make sure you have a solid grasp of the concepts in our first Greek before moving on.

(Γ) Option Gamma Definition: In options trading, the Greek “gamma” measures the rate at which an options delta changes in correspondence to the price of the underlying security.

We learned earlier that the delta of an option is in constant flux with the market. If you watch the Greeks on your trading software, you’ll see they change just as frequently as the stock changes. Where do we find our footing?

Gamma steps in here and tells us how the future delta of an option will change in response to a one-point move in the underlying stock.

Sound confusing? We’ll clear the air in a moment with an example. First, let’s understand a few key concepts about gamma. 

1.) Long Options Yield Positive Gamma; Short Options Yield Negative Gamma

We learned before that the delta of most put options has a negative value, whereas the delta of most call options has a positive value. 

This changes for gamma. Regardless of the option type (call or put), long options always yield a positive gamma. Short options, however, will always yield a negative gamma.

2.) At-the-Money-Options Yield the Highest Gamma

The further in-the-money an option is, the higher its delta is. This is not true for gamma. Gamma yields are highest for at-the-money options.

Why is this? The deltas of at-the-money options are most sensitive to stock price changes. The below screenshot (taken from the tastyworks software) illustrates how high gamma gravitates towards at-the-money options.

AAPL Option Gamma Example

Type Strike Price Delta Gamma New Delta (+$1 Share Price ) New Delta (-$1 Share Price)

Call

147

3.25

.64

.06

.70

.58

Call

148

2.63

.52

.08

.60

.44

Call

149

2.11

.42

.06

.48

.36

Where AAPL is trading at $148.20

The furthest right two columns in the above table illustrate how an options delta will react to a +/−$1  change in the underlying stock. This is calculated by either adding or subtracting gamma to/from the previous delta. 

For a stock increase, we simply add the gamma to the old delta to determine the new delta. For a stock decrease, we subtract the gamma from the delta. 

You will notice that the gamma for the 148 call (the at-the-money call) is higher than the other gammas.

As we said earlier, deltas are most sensitive when at-the-money. Since gamma is a derivative of delta, these moneyness structures are most reactionary to stock price changes. 

If delta is thought of as the speed at which an option moves, gamma can be thought of as the acceleration of this speed. 

Option Gamma vs Days to Expiration

So far, we have looked at how gamma affects the options of a single, near-term expiration cycle. But what affect would time have on the gamma of options expiring in 30 days rather than 3? 

Gamma is always greatest for near-term options. The further away an option is from expiration, the less the gamma will be. Take a look at the below graph to get a better understanding of how time affects gamma. 

Gamma vs DTE

Option Gamma in Long and Short Options

Short option sellers do not want their position to be in-the-money at expiration. Since gamma is highest for at-the-money options, we can therefore deduce that high gamma is bad news for short option positions. 

On the other hand, long option positions profit when the delta approaches 1. Therefore, high gamma is desirable for these positions.

To learn more about gamma, please check out our video below!

3. Option Theta Explained

Our next Greek pertains to something almost all beginner options traders learn the hard way: time decay. 

Unlike stock, all options have an expiration date. If an option is out-of-the-money when it expires, its value will be zero. 

In an environment where implied volatility and stock price remain constant, an out-of-the-money options contract will perpetually shed its extrinsic value (which is the only value out-of-the-money options have) as expiration nears. The option Greek theta tells us the rate at which this decay will happen.

(Θ) Option Theta Definition: The rate of decline in the value of an option attributed to a one-day change in the time to expiration.

Before we jump into theta, it may be helpful to understand the difference between “intrinsic” and “extrinsic” value in options trading. If you’re already familiar with this, please skip ahead!

Option Theta: Intrinsic and Extrinsic Value

The price of all options consists of intrinsic and/or extrinsic value. 

Intrinsic Value Definition: In options trading, intrinsic value represents the value of an option should that option be exercised at the moment of observation.

Extrinsic Value Definition: In options trading, extrinsic value represents all option value that is not intrinsic value.

The intrinsic value of an option is simply the amount that option is in-the-money by. Extrinsic value is everything that is left over. Time and implied volatility play a part in determining an option’s extrinsic value. As time passes, and an option remains out of the money, its extrinsic value will shed. If an option is out-of-the-money on expiration, its value will be zero. 

Let’s look at an example.

AAPL Call Option Example

Stock Price: $150
Call Strike Price: 149
Call Option Price: $3
Extrinsic Value: $2
Intrinsic Value $1

Since our above call option is in-the-money by $1, its intrinsic value is $1. The price of the option, however, is $3. Therefore the remaining $2 must be the option’s intrinsic value.

Like the Greeks, intrinsic and extrinsic values are in constant flux with the market. Check out the below graph, which shows how the different values which comprise a NFLX call option change as time passes and the underlying stock price changes.

NFLX Time Decay

Option Theta and Extrinsic Value

Theta is concerned with extrinsic value. This Greek tells us how much “extrinsic value” an option is expected to lose with each passing day. In an environment where the stock price and implied volatility remain constant, time decay causes an option to lose value.

Think about this intuitively. Let’s say a stock is trading at $130/share. You buy the 135 strike price call for 0.40 that expires in thirty days. If 29 days pass and the stock is still trading at $130, won’t your option decline in value? It’ll probably be worth a few pennies if anything. Theta tells us how fast this decay occurs – on a daily basis. 

Option Theta in Calls and Puts

Theta is kryptonite for long option positions. If we’re long an option, theta causes it to shed value perpetually. This is particularly detrimental for long out-of-the-money options. Why? These options are comprised completely of extrinsic value. In-the-money-options still have intrinsic value, which is unaffected by the passage of time. 

Short option positions, however, love theta. With each passing day, in a constant environment, theta chips away at premium, making a short call or put position more profitable.

For both calls and puts, theta is expressed as a negative value. Like gamma, theta is typically highest for at-the-money options.

AAPL Option Theta Example

Type Strike Price Theta

Call

147

3.25

-.52

Call

148

2.63

-.56

Call

149

2.11

-.54

Where AAPL is trading at $148.20 and expiration 2 days away.

At this point, determining theta should be relatively easy for you. Look at the above options chain, the options of which expire in 2 days. 

With these options so near the end of their life, theta is going to be high. If by tomorrow the stock/implied volatility hasn’t changed, the 148 call (at-the-money) will be trading at 2.07 (Option Price 2.63Theta .56). 

Why such a dramatic change in price? As we said, the option is expiring in 2 days. If we were to look at the theta of an option with a different expiration (30 days to expiration) but the same strike price, the theta will be only -.06.

As the expiration on an option nears, theta accelerates.

Take a moment to study the below image, which shows just how detrimental time can be to the extrinsic value of an at-the-money option over a duration of 90 days.

Time Decay Over 90 days

Option Theta Summary

Before we move on, let’s review a few highlights from theta. After delta, this is the most important Greek.

  • Theta is typically expressed as a negative value
  • Theta is highest for at-the-money options
  • In an environment of constant stock price and implied volatility, theta will perpetually eat away at an options extrinsic value

To learn more about theta, please check out our video below!

4. Option Vega Explained

So far, we have learned about delta, gamma and theta. Delta and gamma show us how an option reacts to a future change in stock price. Theta shows us how an option responds to the passage of time. 

But how will an option react to future changes in implied volatility? 

This is where vega comes in.

(V) Option Vega Definition: In options trading, Vega measures the expected change in the price of an option in response to a 1% change in implied volatility of the underlying security.

First off, it is important to understand that vega and implied volatility are not synonymous. Volatility measures the instability of a stock; vega shows us how an option reacts to potential, future changes in implied volatility.

Option Vega in Calls and Puts

Let’s first understand the fundamentals of vega. 

1.) Vega is Most Affected By At-the-Money Options

I hope you’re starting to see a pattern here. Gamma, theta, and now vega are all at their zenith for at-the-money options. This is true also for vega. Why? At-the-money options are most sensitive to changes in implied volatility.

2.) All Options Have Positive Vega

Whether it be call or put, vega will always be positive for long options. When implied volatility goes up, both calls and puts increase in value. Vega isn’t concerned with the type of option, it focuses on the overall impact a change in future implied volatility will have on all options. 

Long options love vega. Why? An increase in implied volatility is synonymous with the increase of an options price. Option sellers, however, do not like an increase in vega as they hope the options price (and the underlying implied volatility) will decrease. 

AAPL Option Vega Example

Type Strike Price Vega +1% Implied Volatility -2% Implied Volatility

Call

147

3.25

.06

3.31

3.13

Call

148

2.63

.07

2.70

2.49

Call

149

2.11

.06

2.17

1.99

Where AAPL is trading at $148.20 and expiration is 2 days away.

Take a moment to study the above options chain for AAPL. As mentioned above, we can see that the at-the-money option (148 call) has the highest vega. 

So how do we determine how the price of an option would change in response to a 1% increase in implied volatility? Simply add the vega to the value of the option. That’s it!

In the far right column, we threw a bit of a curveball; instead of a 1% decrease in volatility, we changed it to a 2% decrease. To determine how an option will react to a 2% decrease (or even 4%) in implied volatility, you only need to double (or quadruple) the options vega, and then subtract that value from the option price. 

To see how the 148 call would respond to a 2% decrease in implied volatility, just double the vega, and subtract that number from the price (2.63-0.14= 2.49).

To learn more about vega, please check out our video below!

Option Greeks Summary

By this point, you should have a working understanding of how the Greeks can be helpful to you as an options trader. In conclusion, let’s review a few of our key terms. 

  1. Option Delta: Measures how an option responds to changes in the underlying price. 
  2. Option Gamma: Measured the acceleration at which an options delta changes.
  3. Option Theta: Measures how the price of an option changes with a one-day advancement to expiration.
  4. Option Vega: Measured the sensitivity of an option to changes in implied volatility.

Next Lesson

Here’s How a Long Call Option Works (W/ Visuals)

Long Call

The above image represents the profit/loss of a long call position at expiration, where X represents the strike price of the call purchased.

Long Call Definition

In finance, a long call is an options strategy where a trader purchases a stand-alone call contract with the expectation that the underlying security (stock, ETF or index)  will increase in value. Typically, a long call represents the right to purchase 100 shares of the underlying stock at the specified strike price on or before the expiration date.

Long Call Inputs

● Long call at strike price X

Maximum Profit

Unlimited

Maximum Loss

Complete debit paid for call contract X

Breakeven

Strike price X + premium paid

Assignment Risk

None

Best For

Extremely bullish investors

Long Call Option Video

Long Call Option Strategy for Beginners

In options trading, a long call gives the buyer the right to purchase (typically) 100 shares of a stock at the strike price of the call contract on or before the expiration of the option. There are many variables to this rule, but understanding this generality is a good starting point for beginners. 

In order to determine the true dollar cost of an option, this “multiplier effect (leverage)” of 100 tells us we must multiply the options quoted cost by 100. For example, an option quoted at $1.37 will cost us $137 to purchase.

Long Call Option and Moneyness

All options contracts trade in one of three “moneyness” states. This state represents the proximity of the options strikes price to the current stock price. 

  • Out-of-the-Money
  • At-the-money
  • In-the-Money

The most costly of the “moneyness options” are in-the-money. For call options, this state occurs when the underlying security price has surpassed the options strike price. It is for this reason beginner investors prefer trading out-of-the-money calls, as the premium required to purchase these contracts is much lower. 

option moneyness chart calls and puts

Time Decay and Long Calls

The greatest risk that comes with purchasing long call options (particularly when purchased out-of-the-money) is time decay or theta. Theta refers to the rate of decline in the value of the option as time passes.

Take a look at the below options chain for Johnson and Johnson (JNJ) with 28 days to expiration (DTE).  JNJ is trading at $163.50.

JNJ Options Chain

As time passes and the stock remains the same, the odds that JNJ stock will reach the strike price of the call diminishes for out-of-the-money options. This is reflected in the premium of the option. The below options chain is updated to reflect the passage of 21 days. Our model assumes the stock has remained unchanged during the elapsed time and still trades at $163.50/share.

JNJ Options Chain

Let’s explore next why, exactly, our options are priced at the levels they are.

Long Calls and Implied Volatility

Some options are more expensive than others. 

For example, options on JNJ are more expensive than options on PPG Industries (PPG). Both stocks are currently trading at the same exact price, but the October 29th, 2021 calls on JNJ cost more than the same calls on PPG. 

PPG Call Options

JNJ Call Options

This is due to something called “implied volatility”. In options trading, implied volatility tries to predict future price movements of the underlying security. How is this forecasted? By looking at the pricing of the derivatives (options) on the underlying security/stock. 

Historic volatility, unlike implied volatility, looks at the past volatility of options. Historic volatility tells us that the price of PPG tends to undulate more wildly than that of JNJ. Therefore, the premium for options on PPG expiring at a future date must be greater than that of options of the same expiration for JNJ.

Closing a Long Call Position

There are three ways to exit a long call position. The vast majority of traders exit option positions by simply closing the position in the open market (choice #1). You can trade out of options at any time and do not need to wait until the expiration to do so. 

  1. Sell the long call in the open market.
  2. If a call is in-the-money at expiration, your call will be exercised automatically, resulting in 100 long shares of stock per long call.
  3. If the call is out-of-the-money on expiration, it will expire worthless; no action required. 

Final Word

Long calls are reserved for the incredibly bullish investor. Just because a stock goes up in value does not mean the value of a call will go up. In order for an out-of-the-money long call to be profitable, traders need the value of the underlying to go up a lot and fast.

Next Lesson

Stop-Loss Orders On Options Explained

Money in Trap

   Highlights

  • Stop-loss orders are market orders in disguise. Market orders risk horrible fills for options traders
  • For better execution prices, stop-limit orders are recommended
  • The volume, open interest, and bid-ask spread should all be taken into consideration before placing a stop-loss order on options positions

Stop-Loss Order Definition: An order placed with a broker with instructions to either buy or sell a product(s) at the market price when the price of that product reaches the parameter set.

Stop-Loss Orders in Options Trading Explained

When rookie investors are looking for a way to exit a trade, they are given four primary options; market order, limit order, stop-limit order, and stop-loss order.   

Stop-loss. It sounds like a good idea, doesn’t it? If you wanted to exit a position when it met a certain threshold but weren’t around yourself to watch the position, setting a stop-loss seems like a no-brainer.

If your call option contract is trading at $3, you could set a stop loss at $2 and fuhgeddaboudit. After all, won’t this order type prevent any losses below the  $2 level?

No!!!

Stop-Loss Orders Don’t Guarantee Where You’ll Get Filled

What you don’t know when you place a stop-loss order on an options contract(s) is where you’re going to get filled. If you place that $2 stop-loss order tonight and the stock gaps down huge in the after hours, you could very well sell that option when the market opens tomorrow for not $2, but $0.50.

Why? 

Stop-loss orders are simply market orders in disguise. The price you set in a stop-loss simply instructs your broker when to place your market order. From the perspective of a market maker, all they ever see is a market order, or, free money to them!

Stop-Loss Orders: A Cautionary Tale

angry woman

When I was working on an options trade desk, one of the most common complaints we had pertained to fill prices on stop-losses placed on options trades. 

I have seen sell stop-losses set at $3 on an option contract get filled for $0.05 cents on the open, only to trade at $1.00 a few moments later. We used to call stop-losses on illiquid options donations to the market makers’ holiday fund.

Before we get into why placing stop-loss orders on options contracts can sometimes be a very bad idea, let’s do a quick overview of the various order types, starting with a market order. After all, market orders are simply another name for stop-loss orders.

Option Order Types Explained

Though the below order types can be applied to numerous financial investment vehicles (futures contracts, stocks/equities, ETFs), we are going to focus on options. When compared to other markets, those of calls and puts can be considerably less liquid.

1. Market Orders in Options Trading

In options trading, a market order tells the marker makers  you want to be filled on an option position immediately. You do not care what price you get filled at, so long as you get filled that moment. 

Market orders are often filled within a fraction of a second of being sent. Think about that for a moment. If you were to sell (or buy) any product, wouldn’t it feel like you were getting the short end of the stick if somebody bought (sold) that product from you in under a second?

A market order tells markets makers that you’re willing to buy/sell your option(s) for whatever price they are willing to give you. 

Market orders are essentially freebies for the market makers; everybody wants the other side of a market order, particularly Citadel and Virtu!

How Market Orders Work in Options

Auction Gavel

Though your broker has a fiduciary obligation to get you the best execution reasonably available on your market order, there is little transparency to this system. Trust me – in my fifteen years as an options broker in Chicago, I have seen some horrendous fills on market orders in options markets.

So how does it work?

Every time you send a market order, your broker engages in a mini-auction on your behalf, with market makers, sort of like eBay. All of the best bids/asks are gathered, and the best one gets the other side of your trade. Sounds like a good system, but remember; not all products auctioned on eBay sell at their fair market value. 

With market orders on call and put contracts, you have no idea where you are going to get filled. You are at the complete mercy of the market makers. If you are trading a tight and liquid market like AAPL or SPY, chances are, however, you’ll be fine (more on this to come). 

The best order type to use on options (and the only order type I ever use) is a limit order.

2. Limit Orders in Options Trading Explained

A limit order tells your broker that the your limit is the bare minimum fill you will accept. This order communicates to your broker that you are unwilling to:

  1. Buy an option(s) above your specified limit price
  2. Sell an option(s) below your specified limit price

Limit orders are always the best way to both enter and exit options trades. Unlike market orders, with a limit order, you know the price at which you’ll get filled. Sometimes, you’ll even get filled better. 

For traders looking for immediate execution, it is wise to place your limit order at the “mid” price to try and get the best execution. The mid-price is set smack dab in the middle of the bid/ask spread, and will usually be shown on the order-entry page of your trading software. 

3. Stop-Limit Order in Options Trading Explained

A stop-limit order tells your broker to execute a trade at a specified price, or better after a specified stop price has been breached. A stop-limit order must therefore have two components: a stop order (which is simply a “trigger”, not a true stop-loss) and a limit order. 

Take a look at the below image. In a stop-limit order, the stop price triggers a limit order. Remember, in a stop-loss order, the price triggers a market order. 

Stop-Limit Order on SPY

Stop-Limit on SPY

Stop-limit orders are a great risk-management alternative to market orders. Why? You know that your position will never be closed at a price worse than the limit set. 

The downside of a stop-limit order is that if the option blows through the limit you set, you won’t get filled. This is indeed a huge risk.

Stop-Loss Orders on Options and Liquidity

So now that we know what different types of order types you can place, let’s get back to that nasty stop-loss order and see why it can often be a bad idea. 

Poor fills on stop-loss orders and poor liquidity often go hand in hand. 

Illiquid markets almost always mean poor fills. Liquidity simply means the ease at which a security can be converted to cash without having an effect on the market price of the underlying. This means high volume and a tight bid-ask spread. More market participants mean greater liquidity. In order to get an idea of a stock’s liquidity, all you need to do is look at the daily volume. 

For options contracts, this can get a bit more complicated. 

Liquidity in Options Explained

There are 3 important things to consider in this option chain before you place a stop-loss order. You can remember them as the three kings of liquidity. Using the below options chain (from tastyworks) as a point of reference, let’s next take a look at each of these three kings individually.

QQQ Options Chain

1. Liquidity and Bid-Ask Spread

Take a look at the bid/ask spread for this option chain, located under the red circles. Notice how tight these markets are? Usually, the options closest to being “at-the-money” are the most active and therefore the most liquid. QQQ was trading at $343/share when this screenshot was captured. The markets are only 2 cents wide at this 343 strike. 

Now in an ETF like QQQ, a stop-loss order (aka market order) probably won’t hurt you too badly. Though bear in mind we are looking at an expiration cycle that expires in a few days. 

The further out you go in expiation, the wider the spreads get, even on QQQ. 

2. Liquidity and Open Interest

The open interest on an option (as shown under the yellow circles) represents the total number of contracts that are held by traders in active positions. The higher the open interest, the better the liquidity. Take a look at the open interest for the 345 calls, over 52k contracts, wow! That’s a lot of liquidity.

3. Liquidity and Volume

The volume of an options contract (shown in green) tells us the total number of contracts traded on any given day. We can see that the volume for QQQ is exceptionally high. Some strike classes, such as the 345 Call, have traded over 8k contracts already, and the day isn’t even over!

The above three technical metrics should give you a good idea as to the liquidity of a particular stock’s options. A stop-loss order in the QQQ market wouldn’t hurt us too badly. But what about if we were trading the options of a more exotic and less popular stock?

Stop-Loss Orders in Illiquid Markets

Below is the option chain for Jacobs Engineering Group Inc, (from the tastyworks platform) which trades under the symbol “J”.

"J" Options Chain

J Options Chain

Judging from the options chain above, we can tell the symbol “J” is very illiquid. The markets are so bad, not one of our liquidity requirements are met at all. Let’s go through the three kings of liquidity one at a time for J next.

3 Reasons Why "J" is Illiquid

1.)  First off, we are going to take a look at the volume of this stocks options. Most of the calls and puts on this stock have a volume of zero. This means they haven’t traded all day. This should be a red flag: strike one

2.) Next, let’s take a look at the open interest. For the vast majority of put options in this particular series, the volume is 0. Additionally, this is what is called the “front month” expiration series, which means it should be the most liquid of all the options expirations for this stock. Generally, for every expiration cycle, you go out, the less liquid the options will be. Strike 2. 

3.)  Lastly, let’s take a look at this stock’s bid/ask spread. The at-the-money call (140 strike) is 0.45 bid / 0.95 ask. That’s a 0.50 cent wide market, and it doesn’t get much better. If you traded off this spread, you’d lose 0.50 cents immediately. Options markets generally get wider the further you deviate from the at-the-money strike. For example, the market on the 150 call is 0 bid /1.20 offer. Strike three.

Placing a stop-loss on an option in this stock could very well mean a poor fill. For an investor wishing to hedge their risk in J, a stop-limit order would make far more sense.

What Exactly “Triggers” a Stop-Loss Order?

There is no straight answer for this one. At tastyworks, a sell-stop option order is triggered by the ask price. This means that as soon as the option’s ask price falls to our set stop-price, the stop-loss is activated and a market order to sell is sent. For buy stop-loss order at tastyworks, a stop loss is triggered when the bid reaches our stop price. 

Many brokers have different triggering mechanisms for stop-loss orders. Sometimes, you can even choose what triggers your stop order. For example, you can sometimes set up a stop-loss order to trigger when the option “marks” at a particular price. The “mark” of an option is exactly in the middle of the bid and ask.

Setting your own triggering method for a stop-loss order can help to give you a bit more or less wiggly room as well. If you set a sell-stop up to trigger off an options ask, that will trigger faster than if you were to set it up off the options bid.

Final Word

We looked at stop-loss orders mostly through the “worst-case” lens. If you are trading a product with great liquidity, chances are, your fills should be decent. This isn’t guaranteed, however. Having a stop-loss order get filled on the open can be devastating no matter how liquid the security. 

Sometimes, due to life situations, stop-loss orders are necessary. It is therefore wise to only trade options on liquid products.

Recommended Reading

The HUGE risks of a Bitcoin ETF: Futures ETFs Explained

Bitcoin Decay

The prospect of a bitcoin exchange-traded fund (ETF) has been exciting retirement investors for years. After all, aren’t ETFs a great and easy way to provide exposure to a security?

Yes…and no.

The SEC has sure taken its time in approving a bitcoin ETF, and for good reasons.  

In this article, projectfinance will explore these concerns. Hopefully, by the end, you’ll understand why a bitcoin ETF based on futures contracts probably shouldn’t exist. 

Let’s start by understanding the difference between traditional ETFs, and those based on futures contracts (which would be the case for a bitcoin ETF). 

   Highlights

  • A bitcoin ETF will likely be based on futures contracts

  • Futures-based ETFs pose much greater risks than more traditional stock-based ETFs

  • In futures ETFs, contango occurs when the front-month futures contract is valued less than the next month futures contract

  • In addition to contango risks, trading halts on bitcoin futures could have devastating effects on a bitcoin ETF

Future Based ETFs vs Stock Based ETFs

Futures Based ETFs Definition: Exchange-traded funds that attempt to track the performance of an underlying security by investing in one or more futures contracts based on that security. 

First off, let’s understand that not all ETFs are created equally. 

The vast majority of listed ETFs attempt to mirror the performance of their respected index/sector by investing directly in the stocks (equity) that comprise that index. 

Invesco’s QQQ and State Street’s SPY are two such funds. 

QQQ invests directly in the 100 stocks which constitute the Nasdaq-100. SPY invests directly in the 500 stocks which constitute the S&P 500. 

Together, SPY and QQQ represent two of the most widely traded stocks in the entire world. And for good reason; for very low expense ratios, the two ETFs provide direct equity exposure to two of the most highly sought-after indices in the world. 

The keyword here is “equity”. When we invest in equity-based ETF, we know exactly what we are getting: stock. Unlike futures contracts (or options contracts), equity does not expire. Because of this, the correlation between equity ETFs is usually almost 1:1 with the index. 

But this article isn’t focused on equity ETFs; we’re looking at futures ETFs. If you’re brand new to the ETF world, you will understand this material better if you have an understanding of more traditional ETFs first. Reading our article “ETFs Explained: Investing Basics” may be a good starting point for you!

So let’s assume you’re a savvy investor already familiar with the more basic ETFs that provide stock exposure; what if we wanted to invest in a sector that doesn’t have direct stock exposure, such as commodities or volatility?

Futures ETFs Overview

There are numerous futures-based ETFs. In this example, we are going to study only one. If you know how a natural gas futures-based ETF works, the others should be easy to understand (such as a bitcoin futures ETF).

Natural gas prices are skyrocketing. If you wanted to go long on natural gas, there is no stock you could buy that gives you direct access. It isn’t a “company”, but a commodity.

You could buy a natural gas futures contract (/NG) of course, but you need a pretty strong stomach to trade futures, particularly on a commodity as volatile as natural gas. 

Investors wanted a way to gain exposure to natural gas without trading futures contracts. To satisfy this demand, a company called USCF created the United States Natural Gas Fund (Ticker:UNG).

How Futures ETFs Work

So what does UNG invest in since it can’t purchase stock to mirror an index (such as QQQ and SPY)?

Futures! The below is taken from the “Fund Details” page of the UNG fund:

The key to understanding the risks of futures ETFs (like those proposed on Bitcoin) lies in their constitution.

Like options contracts, futures contracts are constantly expiring. If you were running a futures ETF and your current contract was expiring, what would you do? You’d have to roll the expiring futures (front-month) to the next month. 

Therefore, these types of funds must “roll” the futures that comprise their funds in order to stay alive. 

But what if the futures price is different from the price of the actual underlying commodity? That leads to inefficiency. 

Additionally, what about the difference in price between the front month and later month’s futures contract? Is there a difference in price? Yes! And we will likely have to pay in order to establish this roll. More inefficiency.

“Contango” and “Backwardation” in Futures ETFs

The methodology many futures ETFs employ introduces investors to a risk called “Contango” and “Backwardation” (CME Group) – the latter of which can be a benefit but happens less frequently!).

Contango Definition: Contango occurs when the futures price of a commodity/product is higher than the spot price. In regard to futures ETFs, contango occurs when the front-month futures contract is valued less than the next month futures contract

Backwardation Definition: Backwardation occurs when the futures price of a commodity/product is lower than the spot price. In regard to futures ETFs, backwardation occurs when the price of the later expiring future is trading at a value less than the front-month futures contract. 

A little contango occurs naturally in most futures prices because of “the cost of carry”. This is not good for the health of an ETF. Things get really bad for futures ETFs when the contango spread widens. 

Futures ETF in Contango Example

Let’s say the UNG fund is long 100 front-month futures in natural gas. That future is soon to expire. Therefore, to remain exposed to natural gas, the fund must “roll” the future contract to the next month. 

However, futures that expire at a later date often trade at a premium (because of the cost of carry). 

Take a moment to study the different prices of various natural gas futures contracts below from the CME Group’s website. Do you see how the further away from the present date we go, the more expensive the contracts get?

HENRY HUB NATURAL GAS FUTURES

Therefore, when UNG rolls the position from the front-month to the next month, they will incur a small loss. If they did this once, no big deal. But they do it every month!  Will we pay more sometimes than other times? If so, the ETF price will decay with time. 

Are you beginning to see why futures ETFs in bitcoin may spell trouble?

If you’d like to learn more about what could go wrong in a futures-based ETF, check out our video below, highlighting the rise (and decline) of a few volatilities exchange-traded notes (ETN), which use futures in their construction. 

Bitcoin Futures ETF: A Grim Prospect

The more volatile a security is, the more risk an exchange-traded product has when “rolling” its position. 

Last year, Bitcoin shed over 37% of its value in one single day. Bitcoin is volatile as hell, and this poses HUGE risks when it comes to futures ETFs. 

Take a look at the below screenshot from the CME Group, which shows us the various pricing for futures contracts on Bitcoin. Again, you’ll notice how the further out we go, the more expensive the contract becomes. 

CME-Bitcoin Futures Quotes

CME-Bitcoin Futures Quotes

What concerns us is what the premium paid to roll to the next month, and subsequently, the month after that. Will we pay more sometimes than other times? Remember, these quotes are in constant flux!

Contango therefore may indeed post a great risk to futures-based bitcoin ETFs.

But this isn’t the only risk for these types of funds.

Canadian Bitcoin ETFs: A Cautionary Tale

Canada has beaten America in the race to permit bitcoin ETFs; they have already released two. 

The performance of these ETFs (issued by “Horizon’), however, can be a portent for what is to come for Americans should the SEC permit a futures-based ETF on bitcoin. 

In May of 2021, the price of bitcoin tumbled. If you just owned the coin, that would be fine – there is nothing you need to do but wait (and pray!) for the price to go back up. 

However, if you were trading futures on bitcoin during this time, you may have been in trouble. Why? 

The price of bitcoin dropped so much, the Chicago Mercantile Exchange halted trading on the contract

Horizon ETFs out of Canada use the CME futures to create their bitcoin ETFs. The problem?

According to the Financial Times, the company (which runs two bitcoin ETFs), sent an email to their market markets stating that, should Bitcoin remain halted, they would not be able to honor the days buy and sell orders. 

Fortunately for them, the price of bitcoin recovered, and futures on bitcoin began trading again, which allowed them to honor all of the buy and sell orders of the day. 

But what if Bitcoin continued to go down? What would happen to their ETFs? That’s a good question, and one surely the SEC is going over right now.

Final Word

At the end of the day, there are plenty of better alternatives to getting exposure to bitcoin than a futures ETF. Unfortunately, many of these are out of reach for retirement accounts. You can indeed open a bitcoin IRA, but, for most people, this is simply too much work. 

Grayscales’ bitcoin ETF (GBTC) was once a great way for retirement investors to get access to bitcoin. For a while, it traded at a massive premium to bitcoin! However, for a long time since, it has been trading at a steep discount. It is very frustrating when bitcoin is up 1% on the day and your bitcoin trust is down 2%!

Perhaps someday there will be an ETF that directly invests in bitcoin rather than futures on bitcoin. Until then, getting exposure to cryptocurrencies via the stock market could very well end in disappointment.

Long Call Calendar Spreads Explained

Long Calendar Spread

The above graph represents the profit and loss of a long call calendar spread as expiration approaches. Strike price “A” represents the strike price of the options both bought and sold.

Calendar Spread Definition: In options trading, a “calendar spread” is a financial term used to describe a strategy that consists of buying and selling two options of the same underlying security with matching types (call/put) and strike prices, but different expiration dates.

Calendar Spread Max Profit: Back Month Premium (minus) Front Month Premium (minus) Net Spread Debit

Calendar Spread Max Loss: Net Debit Paid

   Highlights

  • A long calendar spread consists of two options of the same type and strike price, but with different expirations

  • Long calendar spreads are great strategies for options traders who believe the stock price will trade near the short option price, allowing traders to profit from “pinning” the future stock price to this strike

  • Calendar spreads offer traders the flexibility to profit in neutral, bullish, and bearish markets

  • The difference in the speed of time decay between the short and long options allows long calendar spreads to profit

After learning how the “single option” and “vertical spread” options strategies work, investors often next turn to the calendar spread. 

If you don’t yet fully understand the mechanics of the above options strategies, you will probably struggle in learning how calendar spreads work.

Why? Calendar spreads are by far more complicated strategies. This article presumes you have a fundamental understanding of basic concepts such as time decay and basic volatility. If you’d like to better understand the more elementary strategies first (or simply need a refresher), projectfinance has some excellent content on both!

Let’s first take a look at the inputs of a vertical spread, as well as a trade example. 

Vertical Spread Components:

Vertical Spread Example:

  • Long AAPL Jan 150 Call 

  • Short AAPL Jan 155 Call

Before we dive into calendar spreads, let’s take a look at a visual from Chris Butler which illustrates why calendar spreads are also known as horizontal spreads.

Vertical Spread vs Calendar Spread

Let’s now take a look at a long calendar spread example composed with calls:

  • Long AAPL Jan 150 Call 

  • Short AAPL Feb 150 Call

In calendar spreads, we have options with different expirations; in vertical spreads, we have different strike prices. In both strategies, the options will still be of the same type (call/puts) as well as quantity. Though the change is minor, trading different expiration cycles within one strategy can complicate matters.

You can either short or go long a calendar spread. This article will focus on long calendar spreads as they are by far the more popular trade. 

How Long Calendar Spreads Work

When you cross expiration cycles, things can get confusing. It’s not just you: most options traders struggle when “time” clouds things up. After all, since we have two options expiring at different times, doesn’t that throw everything off? 

What happens to the other options when one expires? Will we be naked/long? All good questions, and we’ll answer them soon. Let’s dive into a trade example. 

Long Calendar Spread Example

Below, you will find the details of our spread. 

  • Stock Price at Entry: $171.98 

  • Short 170 Call (39 Days to Expiration) for a Credit of $5.50
  • Long 170 Call (74 Days to Expiration) for a Debit of $7.75

Before we get into the analysis, take a moment to try and figure out what we want the underlying to do here. Answers are much better understood when the questions are waiting!

Let’s look at the individual legs first. We paid $7.75 for the 74 days-to-expiration (DTE) call and received a credit of $5.50 for the 39 DTE call.

Since we ultimately paid $2.25 ($7.75-$5.50) for this spread, it is therefore a debit spread. Our max loss is therefore $225.

What interests us most here is the strike price of our spread, which is 170.

Remember, the stock was trading at $171.98 when the trade was put on. Therefore, the spread should profit if the stock price hovers around that level. Let’s find why next.

Long Calendar Spread Over Time

To understand how our above trade plays out in the market, let’s compare the performance of our spread with the performance of the stock over time.

Take a moment to study the above image. Notice how well our spread performs when the stock is trading near our strike price of 170?

These changes are subtle at first, but over time, as time decay, or the Greektheta”, goes to work on the options, this spread becomes much more responsive. Notice how our spread reaches its highest profitability just a few days before expiration?

You may have noticed that the stock was at this same level back in August; why wasn’t our spread at that higher profitability at that point? Because of that “theta” we spoke of earlier, which we will get to. 

Right now, let’s focus on understanding why exactly the price of our calendar spread increased.

Long Calendar Spread Breakdown

The below image shows us how the two components of our calendar spread react to changes in the stock price.

By studying the above chart, we can see that the short 170 call (blue line) decreased at a faster rate than the long 170 call (green line). While both options still lost money, the short leg lost $0.99 more ($3.94-$2.95). Remember, it’s not the individual prices that we’re concerned with, it’s the spread between the prices. 

Since our short option lost more than our long option, the value of our spread increased. Since we own the spread, this is a good thing! Don’t you want the value of something you own to go up?

Understanding Calendar Spread Pricing

As we said before, to determine the price of a long calendar spread, we simply subtract the price of the short option from that of the long option. Take a look at the below image.

At the time of trade entry, the price of our short call was $5.50 while the price of our long call was $7.75. This results in a net debit of $2.25.

As expiration nears, the price of our two options change (as illustrated above).

The total value of the spread has gone from $2.25 to $3.24. That results in a profit of $0.99 to us!

So why did the option we were short going down faster than the option we were long?

Again, when in doubt, think about this intuitively. When two options have the same strike price but different expirations, which one will have more premium? The more time a stock has to move, the more premium that option will have. 

Therefore, the option with 39 DTE (our short) will have decreased faster than our option with 74 DTE (our long). 

Last up, let’s really drive it home by looking at a visual comparing ALL components of the calendar spread. 

Long Calendar Spread: Complete Components

The below image adds to what we have studied by illustrating how all component’s of our trade change over time. 

The top portion of the above graph shows us the changes in the stock price relative to the calendar strike price of 170. The bottom portion of the graph shows us the P/L of the calendar spread as a whole in addition to the components of this spread.

Our short call decreased in value by $3.94. Since we are short this all, this is a profit of $394 to us.

Our long call decreased in value by $2.95. Since we are long this call, we lost $295 here.

What’s the net? $99 ($3.94-$2.95) profit, which can be seen in the middle green line. 

Why Our Long Calendar Spread Increases with a Neutral Stock Price

When purchased near/at the money, the short option in a calendar spread will lose money faster than the long option. This results in a profit for us. Again, in order to understand how this works, you must understand time decay. 

With calendar spreads, you don’t have to trade near-the-money strikes; you can choose whatever strike price you want. When you buy a calendar spread, your aim is to “pin” the future stock price as closely as you can to your chosen short strike price. The further away from the market price you go, the more profit you make (and the lower odds of success you’ll have!).

Please note that our example is elementary; it does not take into account implied volatility. Around earnings season, you will notice the pricing on calendar spreads can be a bit out of whack. 

Some traders even refer to calendar spreads as “long volatility” trades. We disagree. If you’d like to learn more on this or give us your opinion, please check out our video below!

Final Word

Calendar spreads are options strategies definitely reserved for the more advanced options trader. If you don’t know what you’re doing, you can lose quite a bit of money. 

For example, if you decided to “short” a calendar spread, and you mismanaged or simply forgot about the position, you could lose quite a bit of money. How? If you let the long leg on your trade expire without adjustments, you will still be naked short the other call/put.

That being said, since we are dealing with opposing expirations, even long calendar spreads require active management. 

Next Lesson

Dangers of After Hours Options Assignment

Clock and Money

   Highlights

  • ETF and Stock options can be exercised up until 5:30 PM ET on expiration day

  • Traders of short option positions may get assigned if the stock moves against them after the official close

  • To hedge short options that will be assigned, trader’s can exercise a long position if they are in a spread, or trade stock in the open market if the option position is naked

  • To avoid being assigned due to an after-hours move, trade out of all options while the markets are open

Just because the market is closed on expiration day does not necessarily mean your soon-to-be expired out-of-the-money short option position poses no risk. Why? Because options can be exercised up until 5:30 pm (4:30 Central)!

So as to better understand this risk, let’s jump right into an example.

AAPL Example: Getting Assigned After-Hours

Let’s assume you are bearish on AAPL. You decide to sell a vertical call spread on the stock that expires next week, the 140/145 call spread.

  • Short 140 Call 
  • Long 145 Call

A week has passed, and the position has done well. It is expiration day and you check AAPL stock about 3 minutes before the close. The stock is trading at 137.50. You could just buy back your short option for 0.03 cents right now and be done with it, but isn’t that like throwing money away? Isn’t it a sure thing?

So you decide to just let the short portion of your spread expire worthless, saving you both commissions and a few cents in premium.

A few moments later, the bell rings and AAPL closes at 137.97. Great! The stock has settled, and since AAPL is trading under your short call strike price of 140, your position expired worthless, right?

99% of the time, the answer to this question would be yes. In this article, we’re concerned about the other 1%.

Dangers of Short Options Post-close on Expiration

Let’s say that some major news on AAPL was released at 4:09 ET after the market closed. AAPL announced a stock split. Whatever, this doesn’t matter. What matters is the stock immediately skyrockets $3 in value up to $140.50/share.

But this shouldn’t matter to us, right? The closing bell has rung; isn’t our position settled?

No!

Equity and exchange-traded fund (ETF) call options can be exercised up until 5:30 PM CT (4:30 ET). The below quote is from the OIC (Options Industry Council):

Option Can Be Exercised After the Close!

What we should be concerned about in this example is the opposite party that is long the 140 call that we are short. 

Since the stock is trading higher than $140, and that party has the right to buy 100 shares at $140/share up until 5:30 ET if they exercise, what’s to stop them from exercising that right? Since the stock is trading at $140.50, why wouldn’t they immediately sell 100 shares in the open market at this price, and then exercise their call, buying 100 shares at $140?

 When the stock arrives in their account, they will be flat and will have made $0.50 100x, or $50. This is a guaranteed $50! Wouldn’t you do it too?

So what does that mean to us, the short party?

A few hours after the long exercises, we may very well receive an email stating that we have been assigned on our short call. As a result, we will see 100 short shares of AAPL in our account. Since our long call expired worthless, we are unhedged

When Your Expiring Option Goes in the Money After-Hours

So what do we do in this situation? A lot of our response depends upon a trader paying attention and actually witness the after-hours rally. If you are aware, you can do one of three things:

  1. Exercise The Long Call. You can always offset the potential short stock position by exercising your long 145 call. You have until 5:30 ET to do this. But there are a lot of variables at play here. In our example, there is a high likelihood that we will get assigned. But what if the stock only rallied a few pennies beyond your short strike price in the after-hours market; are we guaranteed to get assigned? No. In a situation like this, call your trade desk. Bear in mind that if you have a large spread position, you can always exercise a portion of your long calls to hedge assignment risk as you may not get assigned on all of your calls. It’s really a guessing game!
  2. Hedge with Stock. If you catch your mistake after the 5:30 ET deadline to exercise has passed, and your short position went deep in the money after-hours, you can always hedge the soon-to-be delivered stock by trading the opposite stock position in the extended market. For investors who are trading options naked and have no long position to exercise, this will be their only chance at hedging. Of course, you will deal with illiquid markets. You will have to weigh this risk against waiting until Monday to trade out; a lot can happen over the weekend.

  3. Throw the Dice. The only other course of action is to wait and hope. If the underlying moves only a few pennies in the money in the after-hours market, you may not get assigned at all. When the stock moves a lot, you will likely get assigned. If you do indeed get assigned on a huge position that moves massively against you, beyond the value of your account, your broker can liquidate your account and put you in collections for the amount you owe. For trader’s with very large positions, this may be a good time to find religion!

So what should we have done here?

Trade Out of Short Options Before Expiration

Most brokers charge very little in commissions. tastyworks charges no commissions for exiting trades. Why not just pay a couple of pennies and be done with it? The risk isn’t worth the reward. Unless your short option is out of the money by more than 10%, I would recommend liquidating all short options before the closing bell.

A stock doesn’t have to move drastically in order for us to be concerned either. If the underlying ETF/stock rallies just a couple pennies above our short strike in the after hours, we are still at risk. This is called Pin Risk (Investopedia).

Pin Risk Definition: In finance, pin risk refers to the uncertainty as to whether or not a short call or put option will be assigned leading up to and immediately following the expiration of the contract.

Let’s now take a look at a case study in the real world. 

A Cautionary Tale: Lost $30,000 on a $1-Wide Credit Spread

Chris Butler at Project Finance made a video on how this financial tragedy played out. Feel free to check it out below.

What happened with this trader is a horror story for other options traders. It’s what CAN go wrong when you don’t trade out of short positions before expiration.

Let’s start off by looking at the trader’s position:

Stock: TSLA

Expiration: Sept 4th,2021

Position: Short 410/409 Put Spread (Short 410, Long 409)

Quantity: 5 Spreads

Let’s jump ahead to expiration day now. On the close of this day (at 4PM ET), TSLA stock was trading around $418/share. Now since we are short the 410 put, we should be safe here, right? If you were paying attention to what I said above, you probably can tell where this is going.

Take a look at the middle of the below chart, which illustrates TSLA’s price action about 15 minutes after the closing bell. 

TSLA Stock Falls

By looking at the above chart, we can see that TSLA tanked in the after-hours market. It fell well below the trader’s short put strike of $410.

A little over an hour later, the trader got assigned on all of the 5 short TSLA puts, leaving them with +500 shares of TSLA, worth 200k.

Huge Stock Risk with Assignment

But that’s ok; can’t the trader just exercise their long put to offset the stock position?

Sure, unless you’re broker waits until midnight to notify you, which is exactly what happened here. The trader was helpless, and since the stock wasn’t trading at midnight, they had to wait until Monday morning to trade out. What happened Monday morning? Take a look at the below chart to find out. 

On Monday morning, the stock plummeted. Since the value of the stock was worth a lot more than the traders account, the broker stepped in and liquidated the account, selling the shares for around $350/share.

Remember, the trader bought 500 shares at $410 from the assignment, then sold 500 shares at $350/share Monday morning. The result? A $30,000 loss. This loss completely wiped out the trader’s account.

Final Word

The moral of the story? Close short options before the close! It’s that simple. Paying a couple of pennies to close a trade eradicates huge risk. 

If you’d like to learn more on this subject, be sure to read our article, “Options That Trade Until 4:15 pm (3:15 Central)“.

Recommended Articles

Options That Trade Until 4:15 pm (3:15 Central)

Clock

Not all options stop trading at 4 pm Eastern. In fact, there are quite a few ETFs, ETNs and indices that trade in the after hours up until 4:15 pm Eastern.

Knowing the exact moment a product stops trading is crucial to investors. Why? The reason can be summed up in two words: pin risk.

Pin risk occurs when there is uncertainty as to whether or not an option will expire in the money.

 Highlights

  • There are over 40 products that currently trade options in the after hours markets
  • Pin risk occurs when an option is trading close to being in-the-money as expiration nears
  • A few indices trade that normally trade until 4:15 stop at 4 sharp on expiration day
  • After 4pm, the liquidity for many products dries up

Pin Risk Example

Let’s say we are short a call spread on Invesco’s QQQ. Here is our position:

  • Short 350 Call
  • Long 355 Call

We are going to assume that it is presently expiration day and the closing bell is going to ring in 3 minutes. 

We check the QQQ’s and see they are trading at $349.25. It’s close, but there is still a little risk of assignment on our short 350 call.

A few more minutes pass, and the bell rings. The last print on the QQQ’s was $349.60 at 4 pm Eastern.

We have nothing to worry about, right?

No! Why? Options in this particular ETF trade until 4:15 Eastern time!

If the QQQ’s rally during this time (which isn’t uncommon, especially on “triple witching” days), we are in serious trouble. 

In addition to this risk, option traders can even get assigned in the after hours market even when the underlying security is no longer trading.  Let’s see why next. 

Options Can Be Assigned up Until 4:30 Eastern.

ETF and stock options can be assigned up until 4:30 Eastern time. What does this mean?

If the stock moves against your short option during this time, the long party still has the right to exercise their option. It is therefore wise to trade out of short option position before the options stop trading. You can read more about this on our article, “The Dangers of After Hours Options Assignment”.

Product's That Trade Until 4:15 pm Eastern

So how do we know when our options stop trading? There is no method, only a list. You can find this list below, which was compiled from the NYSE’s “late close” list as well as tastyworks. Please note that products are constantly being added and removed from this list. 

The below products that comprise the list are either exchange-traded notes (ETNs), exchange-traded funds (ETFs) or indices. 

  • AUM
  • AUX
  • BACD
  • BPX
  • BRB
  • BSZ
  • BVZ
  • CDD
  • CITD
  • DBA
  • DBB
  • DBC
  • DBO
  • DBS
  • DIA
  • EEM
  • EFA
  • EUI
  • XEO
  • EUU
  • GAZ
  • GBP
  • GSSD
  • IWM
  • IWN
  • IWO
  • IWV
  • JJC
  • JPMD
  • KBE
  • KRE
  • MDY
  • MLPN
  • MNX
  • MOO
  • MSTD
  • NDO
  • RUT
  • OEX
  • NZD
  • OEF
  • OIL
  • PZO
  • QQQ
  • RVX
  • SFC
  • SKA
  • SLX
  • SPY
  • SPX
  • SPX (PM)
  • SVXY
  • UNG
  • UUP
  • UVXY
  • VIIX
  • VIX
  • VIXM
  • VIXY
  • VXEEM
  • VXST
  • VXX
  • VXZ
  •  XHB
  • XLB
  • XLE
  • XLF
  • XLI
  • XLK
  • XLP
  • XLU
  • XLV
  • XLY
  • XME
  • XRT
  • XSP
  • XSP (AM Expiration)
  • YUK

Indices That Trade Until 4:15 pm Except Expiration

The below indices trade until 4:15 pm except on the most important day of all: expiration. On expiration, the below cash-settled indices stop trading at 4pm Eastern.

  • NDX (weeklys)
  • RUT (weeklys)
  • SPX (weeklys)
  • OEX
  • XEO 

Dangers of Trading in Extended Markets

I would highly recommend options traders to exit all expiring option positions before 4pm Eastern on expiration day. Why?

Market liquidity generally dries up after the official bell. 

I remember one day I had an advisor call me at 3:05 Central (after the bell). The market rallied, and I was forced to trade out of 20k IWM call spreads in an insanely illiquid market. Just the thought of our fill prices that day still makes me sick to my stomach! But at least the market makers were able to order a double-porterhouse at Gibson’s that night. 

Happy trading!

Recommended Videos

Recommended Articles

Differences Between Invesco’s QQQ, QQQM, and QQQJ

QQQ QQQM QQQJ
Fund Name
Category
Large Cap Growth
Large Cap Growth
Mid Cap Growth
Index
NASDAQ-100 Index
NASDAQ-100 Index
Russell Mid Cap Growth
Expense Ratio
0.20%
0.15%
0.15%
Average Stock Market Cap
$828 Billion
$828 Billion
$22 Billion

   Highlights

  • QQQ, QQQM, and QQQJ are all funds issued by Invesco
  • QQQ and QQQM are almost identical, with QQQM having lower fees
  • QQQJ focuses on Nasdaq up-and-coming companies 
  • QQQ and QQQM companies have an average market cap of $825 billion
  • QQQJ companies have an average market cap of $22 billion

The name Invesco has become synonymous with investing in the Nasdaq. This is due mainly to the most senior and popular fund on our list, the Invesco QQQ Trust, or simply, the “Q’s” (QQQ). This Nasdaq-100 index tracking fund consistently ranks within the top-performing ETFs in the US. 

With over $180B in assets under management, the QQQ fund is large, liquid, and provides exposure to some of the most explosive tech companies in the US. 

However, in recent years, the growth of the companies within the Nasdaq-100 has slowed relative to their smaller capitalized peers.

Introducing Invesco's QQQJ ETF

In order to provide investors exposure to these younger up-and-coming Nasdaq companies, Invesco recently created the NASDAQ Next Gen 100 ETF under the ticker QQQJ. The companies within this fund have an average market cap of $22 billion.

In contrast, companies within the QQQ fund have an average market cap of over $825 billion. 

What is Invesco's QQQM ETF?

Invesco’s wildly popular QQQ ETF (mentioned above) was launched back in 1999. In 2020, Invesco launched two additional funds: QQQJ and QQQM. The latter fund is called the Invesco NASDAQ 100 ETF. 

In almost every way, the QQQM ETF is a mirror image of the older and more liquid QQQ fund. They provide the same exact exposure to the Nasdaq-100. There are only three minor differences.

  1. When compared to the QQQs expensive ratio of 0.20%, QQQM charges only 0.15%.
  2. QQQ tends to offer slightly better liquidity than QQQM, but not enough to make up for the additional 0.05% in fees
  3. QQQ is structured as a trust; QQQM is structured as an ETF (this makes no difference to us)

Invesco's QQQ Explained

As of 2021, Invesco’s QQQ ETF has ranked as the 2nd highest traded ETF in the US. So what is it about this ETF that garners so much attention?

Here is how Invesco describes their fund:

Though stated as an exchange-traded fund (ETF), QQQ is technically a unit investment trust (UIT), which should make very little difference to us.

There is a very good reason behind the QQQ’s seemingly inexorable rise. 

With the exception of a few years, the US stock market has been broadly in a bullish market since QQQs birth in 1999. During bullish markets, growth companies tend to outperform value companies. 

As a result of this, the returns of indexes that include value companies (such as the S&P 500 index) pale in comparison to the growth-heavy companies within the Nasdaq-100. 

Take a look at the below 5-year chart comparing State Street’s SPDR® S&P 500® ETF Trust (SPY) to Invesco’s QQQ Trust (QQQ).

SPY vs. QQQ - 5 Year Cart

SPY vs QQQ 5 Year
Chart from Google Finance

During bullish markets, QQQ appears to be the better choice. During bearish markets, QQQ tends to sell off more rapidly than SPY. 

Additionally, since Nasdaq companies are more growth-focused, they rely more upon loans for financing. In an environment of rising interest rates, QQQ may very well underperform SPY, even during bullish markets. This has been proved throughout 2021.

So what companies constitute such stellar performance? Let’s next look at the top ten holdings of QQQ. 

Invesco QQQ Top Ten Holdings

QQQ Top 10 Holdings
Image from Invesco

Is QQQ a Good Investment?

Given the risks that we mentioned above, Nasdaq’s QQQ fund appears to be a great investment for investors who can handle volatile swings. These are generally investors who have long-term investing horizons.

Since Nasdaq tends to underperform the overall market during downtimes, the index is not well suited for investors on the cusp of retirement. Of course, having some exposure to the Nasdaq is a great diversification strategy for all investors. 

However, before you choose to invest in QQQ, make sure you first understand the nature of QQQM.

Unfortunately, there are few Nasdaq funds offered through employer-sponsored 401k plans. A great way to provide exposure to the Nasdaq is therefore through more self-managed IRA’s, such as a Roth or Traditional IRA

Invesco’s QQQM Explained

In 2020, Invesco launched the Nasdaq-100 ETF, QQQM. Here is how Invesco describes their ETF:

Sound familiar to QQQ? The funds are almost identical. 

The main difference to you, the investor, is that QQQM charges a management fee of 0.05% lower than QQQ.

When given the choice between investing in QQQ and QQQM, QQQM wins here for the vast, vast majority of retail traders. Though QQQ provides for marginally better liquidity, this does not make up for the 0.05% additional fees that QQQ charges over QQQM. QQQ simply has greater name recognition.

Invesco QQQM Top 10 Holdings

The companies which comprise QQQM are identical to QQQ, including their respective weightage.

QQQM Top 10 Holdings

Invesco’s QQQJ Explained

Invesco launched their NASDAQ Next Gen 100 ETF (QQQJ) in 2020. Here is how Invesco describes their fund:

The main difference between QQQJ and QQQ/QQQM lies in the companies which constitute the fund. 

QQQ/QQQM invests in the largest 100 companies in the Nasdaq. By reading the above quote, we can see that QQQJ invests in none of these companies, but the 101st-200th largest companies in the Nasdaq. Many of these companies are “mid-caps”.

What does this mean to you?

QQQJ Has Greater Risk than QQQ/QQQM

Generally speaking, smaller market caps coincide with greater risk. Since every one of the stocks within the QQQJ ETF is smaller than QQQ/QQQM, QQQJ in theory should have great market risk, as well as reward.

Since QQQJ is a relatively new fund, it is difficult to put this theory to the test. 2021 has been a choppy year for the markets. With volatile interest rates, everything in the Nasdaq space has been thrown out of whack. With that being said, let’s take a quick look at how QQQJ has compared to QQQ.

QQQ vs QQQJ 1 Year
Orange Line: QQQJ Blue Line: QQQ

Chart from Google Finance

Invesco QQQJ Top Ten Holdings

So what companies does QQQJ invest in? You probably recognized many, if not all of the top ten companies within the QQQ/QQQM funds.

You probably won’t have the same familiarity with the top ten QQQJ companies. Remember, the goal of QQQJ is to invest in the next big thing. If all goes as planned, the names of some of these companies will be just as familiar as those of the QQQs in the future.

QQQJ Top Ten Holdings

Is QQQJ a Good Investment?

We mentioned earlier that when compared to the S&P 500, the Nasdaq-100 (QQQ/QQQM) generally has greater market risk. Therefore, when compared to QQQ, QQQJ has a greater risk. 

It is because of this QQQJ is best suited to investors with very long-term horizons, or for those investors who prefer more risk-on investing.

QQQ vs QQQM vs QQQJ: Sector Exposure

So far, we have focused on the differences between QQQ/QQQM and QQQJ. In truth, these funds are more alike than they are different. This similarity is best illustrated when looking at the sectors these three funds invest in. Let’s compare them below.

Sector allocation is massively important when it comes to investing. The reason QQQ has outperformed SPY by such a wide margin in recent years is due exactly to this.  All of Invesco’s funds on this list have more than 40% of their funds directed in the information technology sector. Take a moment to study the below images to see the other exposures our three funds have.

Take note that the sector allocation for QQQ/QQQM is almost identical. In theory, they should be identical. 

QQQ Sector Allocation

QQQ Sector Allocations
Image from Invesco

QQQM Sector Allocation

QQQM Sector Allocations
Image from Invesco

QQQJ Sector Allocation

QQQJ Sector Allocations
Image from Invesco

Recommended Reading

Additional Resources