?> Chris Butler, Author at projectfinance - Page 7 of 10

Short Put Option Strategy Explained – Guide w/ Visuals

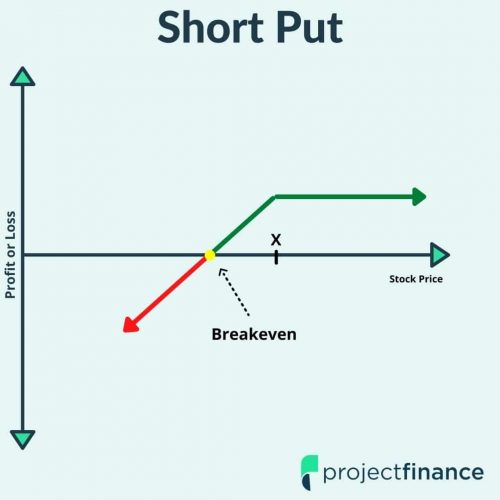
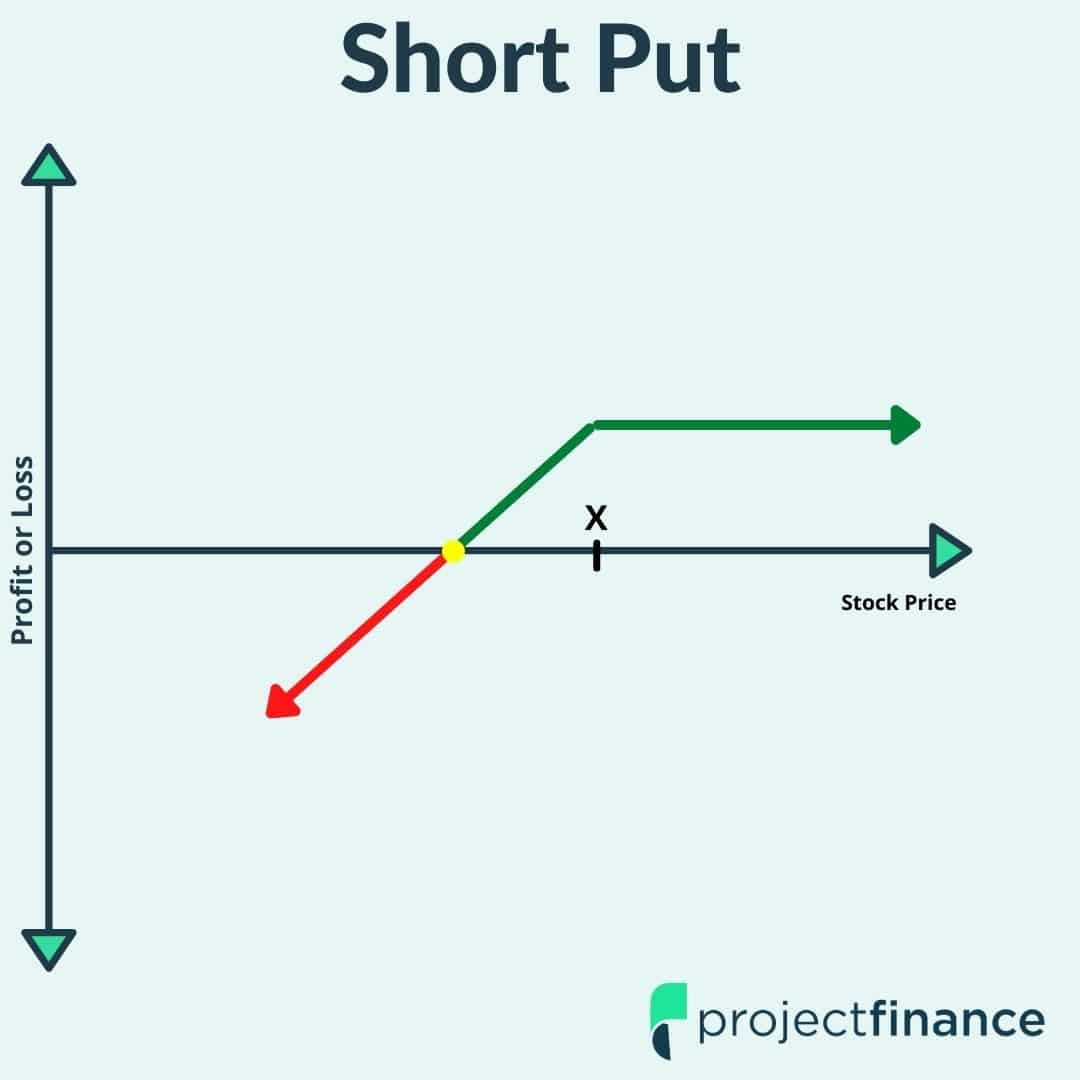
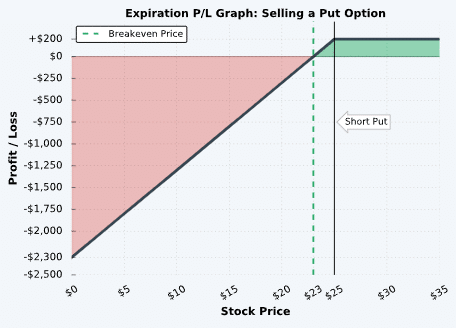
Short Put Option Graph

Selling put options (sometimes referred to as being “short put options”) is an options trading strategy that consists of selling a put option on a stock that a trader believes will increase in price. The risk in this strategy can be great, so it is important have a solid understanding of this options strategy before placing your first short put trade. Let’s get started!

TAKEAWAYS

  • Selling puts is a high probability, high risk strategy for neutral to bullish traders.

  • In the short put, profit is limited to the total credit received.

  • Max loss in short puts is great and calculated by subtracting the credit received from the strike price.

  • The short put is ideal for investors who are willing and ready to purchase a stock should it fall to the strike price sold.

Short Put Strategy Characteristics

Let’s go over the strategy’s general characteristics: 

Max Profit Potential: Put Sale Price (Credit Received) x 100

Max Loss Potential: (Put Strike Price – Credit Received) x 100

Breakeven Price: Put Strike – Credit Received

To better understand these metrics, let’s go through a simple example.

Profit/Loss Potential at Expiration

In the following example, we’ll construct a short put from the following option chain:

In this case, let’s assume the stock price is $25 when entering the put position. For this trade, we’ll sell the 25 put for $2.00.

Stock Price: $25

Put Strike Price: $25

Put Sale Price: $2.00

The following visual describes the potential profits and losses at expiration for this short put position:
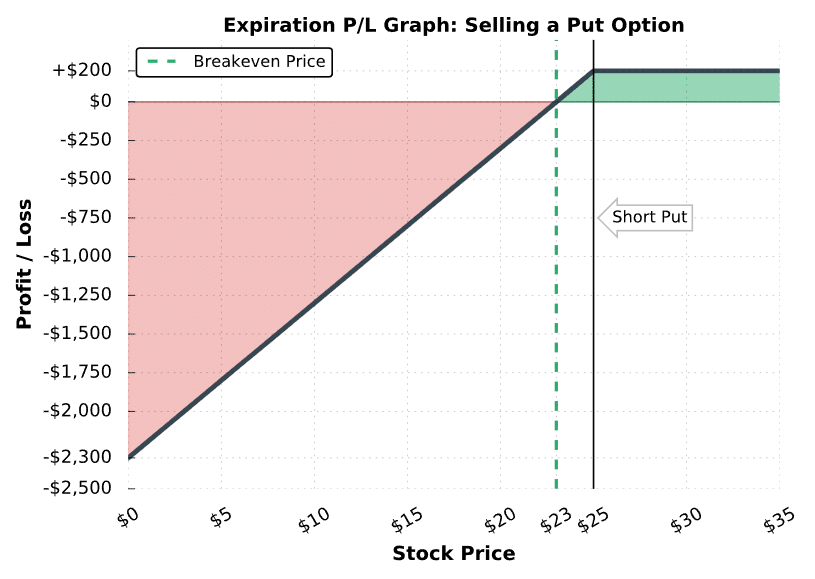
Short Put Trade Results

Stock Price Above the Put’s Strike Price (Above $25)

The put has no​ intrinsic value, and therefore expires worthless. In this case, the put seller realizes the maximum profit of $200.

Stock Price Between the Breakeven Price and the Put’s Strike Price ($23 to $25)

The put option expires with intrinsic value, but not more than the $2 credit the trader collected when selling the put. Consequently, the short put position is profitable.

Stock Price Below the Put’s Breakeven Price (Below $22)

The put option’s intrinsic value is now greater than the premium the trader collected when selling the put, and therefore the short put position is not profitable.

Stock Price at Zero

The company has gone out of business. Any short put traders will realize the maximum loss potential. For the seller of the 25 put, the loss will be $2,300: ($2 Put Sale Price – $25 Put Expiration Value) x 100 = -$2,300.

Short Puts = High Probability/High Risk

The last thing we’ll point out about this graph is that the breakeven price is below the current stock price. Because of this, selling puts is a high probability strategy. However, this makes sense since the maximum potential loss is greater than the maximum potential reward.

So, you know how the outcomes at expiration when selling puts, but what about before expiration? Understanding how profits and losses occur when selling put options can be explained by the position’s option Greeks (if you want to improve your understanding of the risks of your option positions, read our ultimate guides on the option Greeks).

Nice job! You’ve learned the general characteristics of the put selling strategy. Now, let’s go through some visual examples to solidify your knowledge of how short puts work.

Maximum Profit Short Put - Trade Example #1

To visualize the performance of selling put options, let’s look at a few examples of real puts that recently traded. Note that we don’t specify the underlying, since the same concepts apply to all stocks in the market.

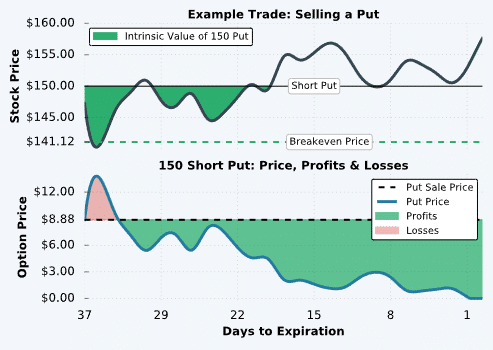
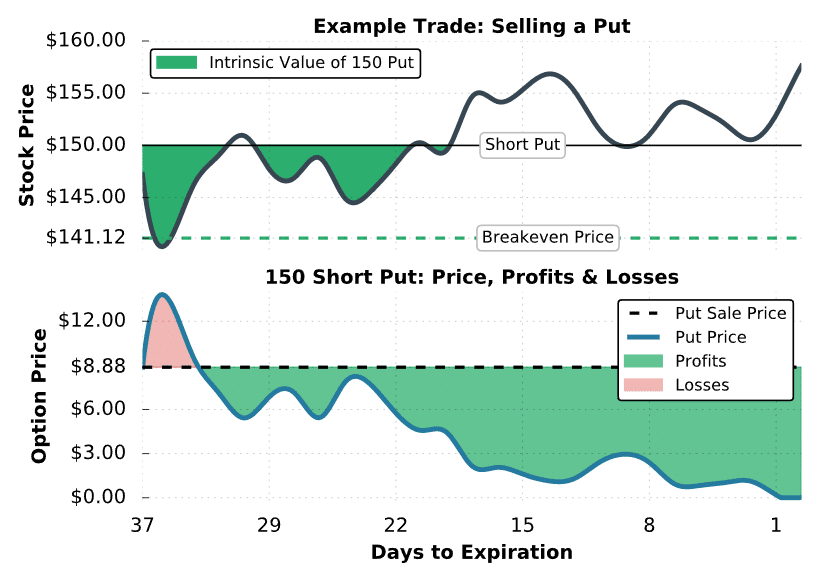
The first example we’ll look at is a situation where a trader sells an at-the-money put option (strike price near the stock price). Here are the specifics:

Initial Stock Price: $147.23

Initial Implied Volatility: 43%

Put Strike and DTE: 150 put expiring in 37 days

Put Sale Price: $8.88

Put Breakeven Price: $150 short put strike – $8.88 credit received = $141.12

Maximum Profit Potential: $8.88 net credit x 100 = $888

Maximum Loss Potential: $141.12 breakeven price x 100 = $14,112 (stock price at $0)

Let’s see what happens!
Short Put Trade Results

As you can see, selling puts is profitable as long as the stock price doesn’t fall quickly and violently. You’ll notice that around 21 days to expiration, the stock price is trading right at the put’s strike price of $150, but the put is worth half of its initial value. Three factors contribute to the put’s price decrease:

1) 15 days have passed, resulting in the decay of the put’s extrinsic value

2) Implied volatility has fallen from 43% to 31% (not visualized by the graph), which indicates a broad decrease in the stock’s option prices. 

3) The stock price has risen by $3, which results in lower put prices compared to before. Why? When the stock price increases, put options at every strike price become less valuable because they have a lower probability of expiring in-the-money.

Since short put positions have positive theta, negative vega and positive delta, they profit from the passage of time, decreasing implied volatility, and increasing stock prices. All three of these occurred in this trade example.

Regarding closing this position early, the trader in this example had many opportunities to close the put before expiration to lock in profitsTo close a short put, a trader can buy back the put at its current price. As an example, if the trader in this example bought the put back when it was worth $3.00, they would lock in $588 in profits: ($8.88 initial sale price – $3.00 purchase price) x 100 = +$588. If held to expiration, the profit would have been $888 because the put expired worthless.

Next, we’ll look at an example of a short put trade where the stock price is below the put’s strike price at expiration.

Partially Profitable Short Put - Trade Example #2

When the stock price is below a short put’s strike price at expiration, the put seller will not make the full profit potential. However, it is still possible that the trade could work out. To demonstrate this, let’s look at an example where the stock price is trading below the short put’s strike price at expiration.

Here are the specifics:

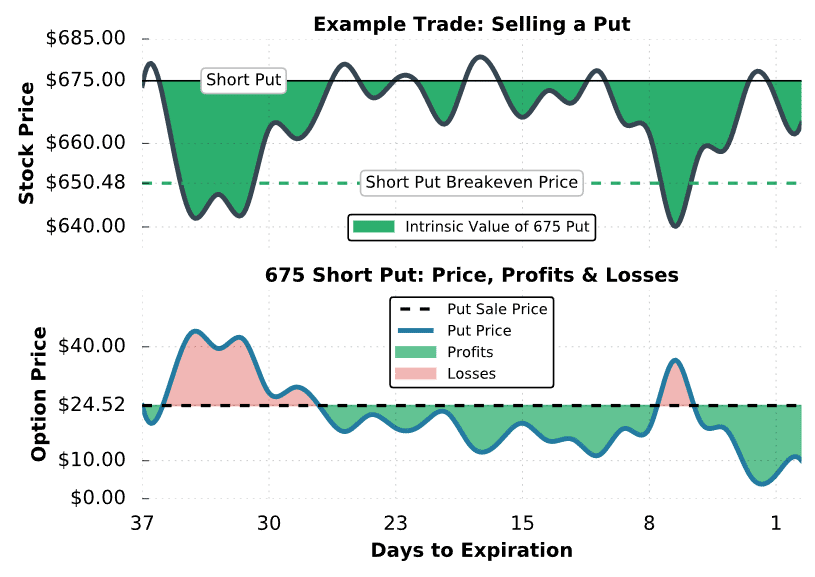
Initial Stock Price: $673.86

Initial Implied Volatility: 30%

Strike and Expiration: 675 put expiring in 37 days

Put Sale Price: $24.52

Put Breakeven Price: $675 short put strike – $24.52 credit received = $650.48

Maximum Profit Potential: $24.52 credit received x 100 = $2,452

Maximum Loss Potential: $650.48 breakeven price x 100 = $65,048 (stock price at $0)

Let’s take a look at the trade’s performance:
short put #2

Short Put #2 Trade Results

In this trade, the initial sale price of the 675 put was $24.52, resulting in a breakeven price of $650.48. Initially, the stock price crashed to nearly $640, which is well below the put’s breakeven price. As a result, the price of the 675 put surged to $42, which represents a $1,700 loss for the put seller.

However, the stock regained its losses and was trading around $665 at expiration. With the stock price $10 below the put’s strike price at expiration, the put was worth its intrinsic value of $10. Since the initial sale price was $24.52, the final profit is $1,452 per contract for the put seller: ($24.52 sale price – $10 expiration price) x 100 = +$1,452.

If the put seller let the put expire in-the-money, the resulting position would be +100 shares of stock. Letting an option expire in-the-money is known as “taking assignment.” In the case that the trader doesn’t want a stock position, the short put can be purchased back before expiration. However, keep in mind that it’s always possible to be assigned 100 shares of stock on an in-the-money short put, but unlikely when the put has plenty of extrinsic value.

Alright, you know how well short puts can do. Let’s finish by investigating what can go wrong when selling puts.

Significant Loss from Selling Puts - Trade Example #3

So, what happens when the stock price falls through the strike price of a short put? To demonstrate this, we’ll look at a situation where a trader sells an at-the-money put before the stock price drops significantly.

Here are the specifics of the next example:

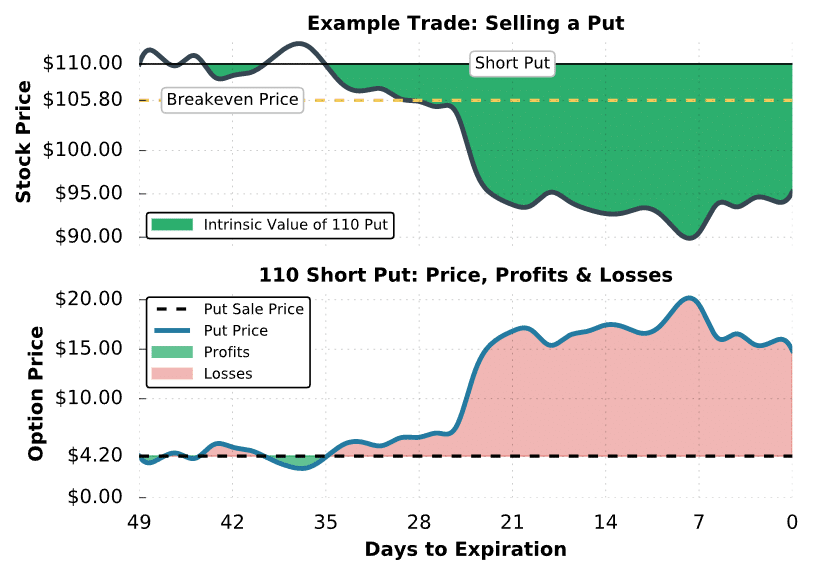
Initial Stock Price: $109.99

Initial Implied Volatility: 27.5%

Strike and Expiration: 110 put expiring in 49 days

Put Sale Price: $4.20

Put Breakeven Price: $110 put strike price – $4.20 credit received = $105.80

Maximum Profit Potential: $4.20 credit received x 100 = $420

Maximum Loss Potential: $105.80 breakeven price x 100 = $10,580 (stock price at $0)

Let’s see what happens!
selling a put chart

Short Put #3 Trade Results

In the first 14 days of this trade, the short put trader didn’t have significant profits or losses. However, things changed quickly when the stock price plummeted 10% after an earnings report. 

With 21 days to expiration, the 110 put was worth $17, which is four times more than the initial sale price. At expiration, the stock price was $95, which meant the 110 put had $15 of intrinsic value. Unfortunately, this resulted in a loss of $1,080 per contract for the put seller: ($4.20 sale price – $15 expiration price) x 100 = -$1,080.

As mentioned earlier, it’s always possible to close the position early to lock in losses. For example, if this particular trader wanted to take their losses when the put traded $10, they could buy the put back and lock in $580 in losses: ($4.20 initial sale price – $10.00 purchase price) x 100 = -$580.

In summary, keep in mind that things don’t always work out when trading a high probability strategy such as selling puts. However, there’s always an exit opportunity if the losses get out of hand.

Final Word

Congratulations! You now know how selling put options works as a trading strategy. Be sure to revisit this guide often to solidify what you’ve learned.

In a nutshell, here is what we learned:

  • Short puts have great downside risk.
  • With decreasing extrinsic value, short puts have a greater chance of being assigned. 
  • The maximum profit on short puts is limited to the credit received.
  • More premium can be collected from puts when the implied volatility is elevated
Chris Butler portrait

Bearish Options Trading Strategies (In-Depth Tutorials)

Options strategies suitable for bearish (negative) market outlooks.


Buying Put Options

buying put options

Bear Put Spreads

bear put spreads

Selling Call Options

selling call options

Bear Call Spreads

bear call spreads

Covered Put Writing

covered put

Synthetic Short Stock

Chris Butler portrait

The Ultimate Bullish Option Strategy Guides

bull

Options strategies suitable for bullish (positive) market outlooks.


Buying Call Options

buying calls

Buying Call Spreads

buying call spreads

Selling Put Options

Bull Put Spreads

Covered Call Writing

covered call writing

Covered Strangle

covered strangle

Married (Protective) Put

Married (Protective) Put
Chris Butler portrait

Options Trading Strategy Guides (With Trade Visuals)

Learn options strategies for any stock price/market outlook.


Bullish Strategies

bullish strategies

Bullish options strategies profit from stock price increases, and range from conservative to aggressive.


Bearish Strategies

bearish strategies

Bearish options strategies profit from stock price decreases, and range from conservative to aggressive.


Neutral Strategies

neutral strategies

Neutral options strategies profit from range-bound stocks, and range from conservative to aggressive.


*NEW* - The Ultimate Guide to Vertical Spreads

Vertical strategy options

Learn everything you need to know about vertical spreads. These four strategies are all you may ever need in your trading approach.

 
Chris Butler portrait

tastytrade Analysis Tab (Trading Platform Tutorial)

The tastytrade trading platform is what we use to trade stock, options and futures. tastytrade has changed the trading industry by introducing a revolutionary commission structure (close trades for free, $10 commission-cap per option leg, and more), and a clean, intuitive trading platform.

In this tastytrade tutorial, we’ll cover the analysis tab, which is where you can visualize and analyze a trade’s profit and loss potential before placing the trade. More specifically, you’ll learn:

 How to access the Analysis Tab on the tastytrade trading platform.

✓ How to interpret the risk profile graph.

✓ Changing the Evaluate At Date and Implied Volatility inputs to gauge options strategy performance in different scenarios.

tastytrade, Inc. (“tastytrade”) has entered into a Marketing Agreement with Project Finance (“Marketing Agent”) whereby tastytrade pays compensation to Marketing Agent to recommend tastytrade’s brokerage services. The existence of this Marketing Agreement should not be deemed as an endorsement or recommendation of Marketing Agent by tastytrade and/or any of its affiliated companies. Neither tastytrade nor any of its affiliated companies is responsible for the privacy practices of Marketing Agent or this website. tastytrade does not warrant the accuracy or content of the products or services offered by Marketing Agent or this website. Marketing Agent is independent and is not an affiliate of tastytrade. tastytrade was previously known as tastyworks, Inc.
tastytrade, Inc. (“tastytrade”) has entered into a Marketing Agreement
with Project Finance (“Marketing Agent”) whereby tastytrade pays
compensation to Marketing Agent to recommend tastytrade’s brokerage
services. The existence of this Marketing Agreement
should not be deemed as an endorsement or recommendation of Marketing
Agent by tastytrade and/or any of its affiliated companies. Neither
tastytrade nor any of its affiliated companies is responsible for the
privacy practices of Marketing Agent or this website.
tastytrade does not warrant the accuracy or content of the products or
services offered by Marketing Agent or this website. Marketing Agent is
independent and is not an affiliate of tastytrade. tastytrade was
previously known as tastyworks, Inc.

Chris Butler portrait

tastytrade Positions Tab (Trading Platform Tutorial)

The tastytrade trading platform is what we use to trade stock, options and futures. tastytrade has changed the trading industry by introducing a revolutionary commission structure (close trades for free, $10 commission-cap per option leg, and more), and a clean, intuitive trading platform.

In this tastytrade tutorial, we’ll cover the positions tab, which is where you can access and analyze the performance of all your portfolio positions. More specifically, you’ll learn:

 How to access the Positions Tab on the tastytrade trading platform.

✓ How to customize the metrics/columns seen on the Positions Tab.

✓ Using the Profit Target % and other key features.

tastytrade, Inc. (“tastytrade”) has entered into a Marketing Agreement with Project Finance (“Marketing Agent”) whereby tastytrade pays compensation to Marketing Agent to recommend tastytrade’s brokerage services. The existence of this Marketing Agreement should not be deemed as an endorsement or recommendation of Marketing Agent by tastytrade and/or any of its affiliated companies. Neither tastytrade nor any of its affiliated companies is responsible for the privacy practices of Marketing Agent or this website. tastytrade does not warrant the accuracy or content of the products or services offered by Marketing Agent or this website. Marketing Agent is independent and is not an affiliate of tastytrade. tastytrade was previously known as tastyworks, Inc.

 
Chris Butler portrait

tastytrade Trade Tab (Ultimate Trading Platform Tutorial)

The tastytrade trading platform is what we use to trade stock, options and futures. tastytrade has changed the trading industry by introducing a revolutionary commission structure (close trades for free, $10 commission-cap per option leg, and more), and a clean, intuitive trading platform.

In this tastytrade tutorial, we’ll cover the trade tab, which is where you can access all of a stock’s options, set up strategies, analyze trades, and execute orders. More specifically, you’ll learn:

 How to access the Trade Tab on the tastytrade trading platform.

✓ How to filter standard/non-standard option expiration cycles.

✓ Customizing the columns seen on the option chain.

✓ How to interpret the Trade Info metrics (POP, EXT, P50, Delta, Theta, Max Profit, Max Loss).

✓ How to adjust strike prices, trade quantities, and expiration cycles with the click of a button.

tastytrade, Inc. (“tastytrade”) has entered into a Marketing Agreement
with Project Finance (“Marketing Agent”) whereby tastytrade pays
compensation to Marketing Agent to recommend tastytrade’s brokerage
services. The existence of this Marketing Agreement
should not be deemed as an endorsement or recommendation of Marketing
Agent by tastytrade and/or any of its affiliated companies. Neither
tastytrade nor any of its affiliated companies is responsible for the
privacy practices of Marketing Agent or this website.
tastytrade does not warrant the accuracy or content of the products or
services offered by Marketing Agent or this website. Marketing Agent is
independent and is not an affiliate of tastytrade. tastytrade was
previously known as tastyworks, Inc.

Chris Butler portrait

Why Trade With tastytrade? ​(Ultimate Platform Overview)

The tastytrade trading platform is what we use to trade stock, options and futures. tastytrade has changed the trading industry by introducing a revolutionary commission structure (close trades for free, $10 commission-cap per option leg, and more), and clean, intuitive trading software.

In this tastytrade video, we’ll take a look at the tastytrade commission structure and their trading software so you can see how traders of all types can benefit when trading with tastytrade.

tastytrade, Inc. (“tastytrade”) has entered into a Marketing Agreement with Project Finance (“Marketing Agent”) whereby tastytrade pays compensation to Marketing Agent to recommend tastytrade’s brokerage services. The existence of this Marketing Agreement should not be deemed as an endorsement or recommendation of Marketing Agent by tastytrade and/or any of its affiliated companies. Neither tastytrade nor any of its affiliated companies is responsible for the privacy practices of Marketing Agent or this website. tastytrade does not warrant the accuracy or content of the products or services offered by Marketing Agent or this website. Marketing Agent is independent and is not an affiliate of tastytrade. tastytrade was previously known as tastyworks, Inc.

Chris Butler portrait

IV Rank vs. IV Percentile: Which is Better?

When trading options, understanding both IV rank and IV percentile can be very advantageous – but is one metric more beneficial than the other? In this article, projectfinance will stack these two volatility metrics side by side – and declare a winner!

Stocks and Implied Volatility

All stocks in the market have unique personalities in terms of implied volatility (their option prices). For example, one stock might have an implied volatility of 30%, while another has an implied volatility of 50%. Even more, the 30% IV stock might usually trade with 20% IV, in which case 30% is high. On the other hand, the 50% IV stock might usually trade with 75% IV, in which case 50% is low.

So, how do we determine whether a stock’s option prices (IV) are relatively high or low?

The solution is to compare each stock’s IV against its historical IV levels. We can accomplish this by converting a stock’s current IV into a rank or percentile.


Implied Volatility Rank (IV Rank) Explained

Implied volatility rank (IV rank) compares a stock’s current IV to its IV range over a certain time period (typically one year).

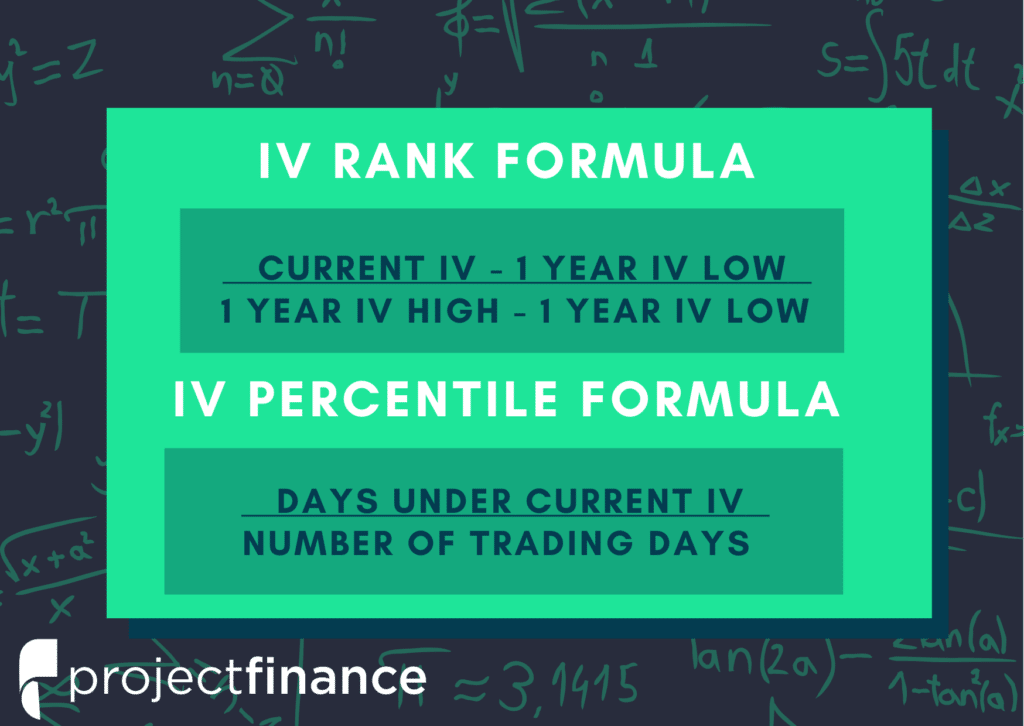
Here’s the formula for one-year IV rank:


iv rank formula 2

For example, the IV rank for a 20% IV stock with a one-year IV range between 15% and 35% would be:


iv rank example

An IV rank of 25% means that the difference between the current IV and the low IV is only 25% of the entire IV range over the past year, which means the current IV is closer to the low end of historical volatility

Furthermore, an IV rank of 0% indicates that the current IV is the very bottom of the one-year range, and an IV rank of 100% indicates that the current IV is at the top of the one-year range.

Implied Volatility Percentile (IV Percentile) Explained

Implied volatility percentile (IV percentile) tells you the percentage of days in the past that a stock’s IV was lower than its current IV.

Here’s the formula for calculating a one-year IV percentile:


IV percentile formula

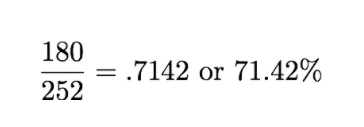
As an example, let’s say a stock’s current IV is 35%, and in 180 of the past 252 days, the stock’s IV has been below 35%. In this case, the stock’s 35% implied volatility represents an IV percentile equal to:


IV percentile formula example

An IV percentile of 71.42% tells us that the stock’s IV has been below 35% approximately 71% of the time over the past year.

Applications of IV Rank and IV Percentile

Why does it help to know whether a stock’s current implied volatility is relatively high or low? Well, many traders use IV rank or IV percentile as a way to determine appropriate strategies for that stock.

For example, if a stock’s IV rank is 90%, then a trader might look to implement strategies that profit from a decrease in the stock’s implied volatility, as the IV rank of 90% indicates that the stock’s current IV is at the top of its range over the past year (for a one-year IV rank).

On the other hand, if a stock’s IV rank is 0%, then options traders might look to implement strategies that profit from an increase in implied volatility, as the IV rank of 0% indicates the stock’s current implied volatility is at the bottom of its range over the past year.

So, with IV rank and IV percentile at your disposal, which one should you use? Is one better than the other? In the next section, we’ll compare the two metrics visually, and explain why one may be better than the other.

IV Rank vs. IV Percentile: Which is Better?

So, at this point you know about IV rank and IV percentile as a means to gauging a stock’s current vs. historical levels of implied volatility, but which one should you use?

IV Rank Doesn't Tell the Whole Story

Recall that IV rank tells you where a stock’s current implied volatility lies relative to its IV range over a certain period of time, typically a year.

One of the issues with IV rank is that if a stock’s IV surges to an abnormally high level, almost all IV rank readings going forward will be low, even if the stock’s current IV is still relatively high.

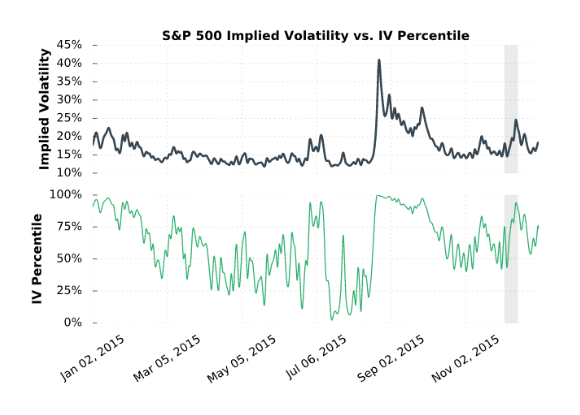
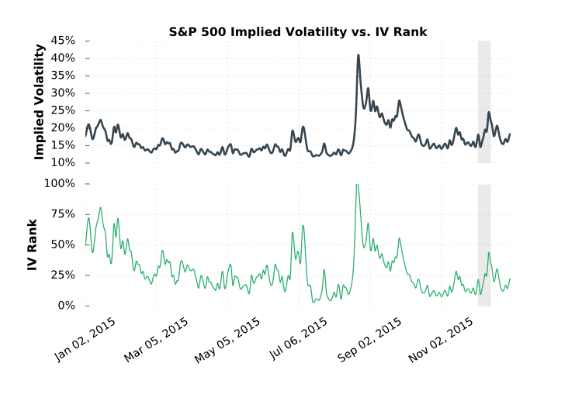
As an example, consider the following chart:

If you focus your attention on the very first days in this chart, you’ll notice that the S&P 500 implied volatility was around 22.5%, which translated to an IV rank over 75%. However, later on in the year implied volatility spikes to 40%. In the shaded region on the very right of the graph, you’ll notice that implied volatility rises to 25%, but now IV rank is less than 50%.

When IV falls after a massive surge in implied volatility, IV rank readings will be low even when the implied volatility of the stock price is still relatively high. In this example, the implied volatility of the S&P 500 is below 20% almost the entire year, but after the significant spike in implied volatility, the IV of 25% translates to an IV rank less than 50% later in the year.

Now, let’s look at the same time period, except this time we’ll examine IV percentile:


As we can see, even after the spike in implied volatility to 40%, the rise in implied volatility to 25% at the end of the year translated to an IV percentile of 93%, indicating that implied volatility was below 25% in 93% of the days over the past year.

Now, when the implied volatility of the S&P 500 spiked to 40%, what would happen if it stayed at 40% for an extended period of time? Well, IV rank would be pinned at 100%, telling you that the 40% IV is the highest implied volatility the S&P 500 has seen over the past year. However, IV percentile would fall, as the 40% IV becomes more “normal.” So, when a market’s implied volatility personality changes, IV percentile will be the first to let you know.

Final Word

IV Percentile

So, the bottom line is that IV rank or IV percentile can be used to gauge a stock’s level of implied volatility (current level of volatility) relative to its historical levels of implied volatility. However, IV percentile tells you more of the story, and serves as a better “mean-reversion” indicator. Furthermore, IV percentile doesn’t suffer from the flaw of IV rank after an abnormally large increase in implied volatility.

IV Rank vs IV Percentile FAQs

IV rank and IV percentile are not the same. Both IV rank and IV percentile examine current levels of implied volatility, but they do so using different metrics. IV rank compares present IV to both high and low volatility levels over the past 252 days; IV percentile tells us the percentage of days over the last year when IV was lower than its present level.

IV rank tells us whether the current implied volatility is high or low in relation to the historic one year volatility of an underlying. 

When the IV percentile for an underlying is high, that implies option premiums will also be elevated. This may be a good time to sell premium using options strategies such as strangles, straddles, vertical spreads (credit spreads) and iron condors. However, if you believe the stock price will experience even higher volatility in the short-term, debit spreads may be more appropriate. 

Additionally, with low IV percentile, traders tend to favor net long positions in options. 

Chris Butler portrait

VIX Term Structure – The Ultimate Guide w/ Visuals

The VIX term structure (sometimes called the “VIX futures curve”) is the relationship between the prices of short-term and long-term VIX futures contracts. 

The shape of the VIX futures prices when plotted (upwards, downwards, or flat) indicates whether the market is expecting more or less market volatility in shorter-term or longer-term periods.

Additionally, the shape of the VIX futures curve has implications for the performance of volatility-related products.

The shape of the VIX term structure will fall into one of three categories:

➼ Contango (Upward Sloping): Longer-term VIX futures contracts are more expensive than shorter-term contracts. Contango tends to occur in quiet market periods and is also the most common shape of the VIX futures curve.

➼ Backwardation (Downward Sloping): Longer-term VIX futures contracts are less expensive than shorter-term contracts. Backwardation tends to occur during periods of extreme market volatility.

➼ Flat: Longer-term VIX futures contracts are about the same price as shorter-term contracts.

To understand each of these curves, let’s look at an example of each scenario.

Contango: Upward-Sloping VIX Futures Curve

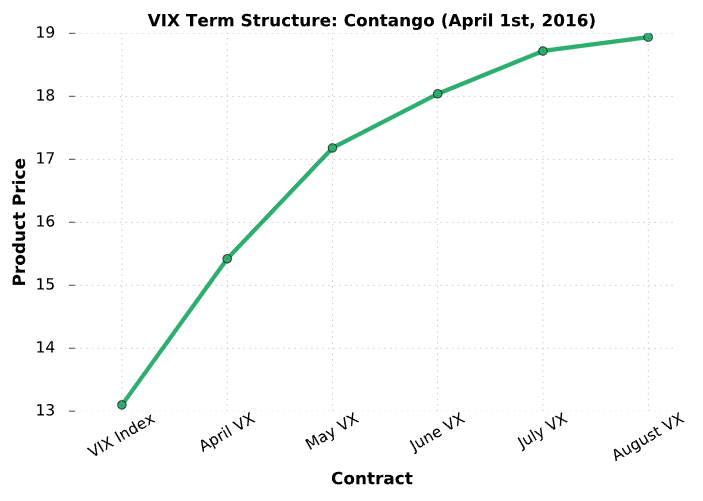
The following chart demonstrates what an upward-sloping (contango) VIX term structure looks like:


VIX Term Structure (VIX Futures Curve) in Contango

Data gathered from the Cboe’s Historical VIX Futures Database

In this example, the VIX Index itself is just above 13 while the August VIX future (approximately 120 days away from settlement) is six points higher at 19. The upward sloping nature of the curve suggests that market participants believe volatility will increase from 13 in the future, which makes sense because the long-term average VIX level is around 20.

In the event that the VIX Index (prices of S&P 500 options) remains around 13, the price of each of these VIX futures contracts will lose value as time passes.

Consequently, any long VIX futures traders will lose money, as well as traders who have on bullish trades in related volatility products (bullish VIX option trades, VXX, UVXY, etc.). On the other hand, traders with short VIX futures contracts or bearish positions in volatility products will are likely to profit (bearish VIX option trades, long XIV or SVXY, etc.).

Backwardation: Downward-Sloping VIX Futures Curve

The following chart demonstrates what a downward-sloping (backwardated) VIX term structure looks like:


VIX Term Structure (VIX Futures Curve) in Backwardation

Data gathered from the Cboe’s Historical VIX Futures Database

In this case, the VIX Index is above 27. However, the June VIX futures contract (roughly 150 days until settlement) is four points lower at 23. The downward-sloping nature of the curve suggests that market participants believe volatility will decrease from 27 in the future, which makes sense because the long-term average VIX level is around 20.

In the event that the VIX Index (prices of S&P 500 options) remains around 27, the price of each of these VIX futures contracts will “slide up the curve” as time passes. Consequently, any short VIX futures traders will lose money, as well as traders who have on bearish trades in related volatility products (VIX options, VXX, UVXY, etc.). However, any traders who are long VIX futures or have bullish positions in volatility products are likely to make money.d

Flat VIX Futures Curve

In the final example, we’ll look at a relatively flat VIX term structure from early 2016:


Flat VIX Term Structure (VIX Futures Curve)

Data gathered from the Cboe’s Historical VIX Futures Database

In this case, the VIX index is at 20 while the five subsequent VIX futures contracts are near 21. While not exactly equal, this VIX futures curve can be described as flat. When the VIX term structure is flat, long and short volatility trades don’t stand to gain or lose too much money if the VIX remains at its current level of 20. However, this could change quickly if the shape of the curve transitions into steep contango or backwardation.

Chris Butler portrait