?> Chris Butler, Author at projectfinance

How to Calculate Your Roth IRA and 401k Paychecks

Calculate Retirement Paychecks

Saving for retirement is a big deal. Every one of us needs some way to survive when we age out of the workforce and retire. Some lucky few can start successful ventures and save more money than they can ever spend, but most of us need to be a little slower and more deliberate with it.

We rely on a 401(k), an IRA, or multiple accounts to fund retirement. The trouble is, it’s pretty challenging to determine just how much you’ll have to live on when you retire. There are many moving parts and different factors to consider.

Moreover, if you search online, much of what you’ll find is about saving for retirement, not how to calculate what you’ll have as a payout when you finally retire.

How can you estimate what your retirement paychecks will be?

Let’s get started.

Age of Retirement

The average retirement age varies by location, culture, and income level. The one commonality is the age of 60. With an average life expectancy of about 78 in America today, this gives you a solid two decades to enjoy the twilight of your life. Of course, some people don’t retire until 65 or even 70.

Life Expectancy and Retirement Chart

The commonality is the age of required disbursements from investments.

Both IRAs and 401(k)s allow you to start taking payments from them when you hit a certain age. 

That age, as of current laws, is 59 ½. 

Why the half-year, and not just 59 or 60? Who knows! 

There’s probably a reason buried in the depths of time, but if there is, it’s not easy to find.

Additionally, those accounts require you to start taking payments at age 72.  

On top of that, some people qualify for early disbursements, starting at age 55. Specifically, if you leave your job once you turn 55, you may be able to take payments from that job’s 401(k) plan without penalty. Like a 401(k) you own or an IRA, other accounts do not allow this exception.

The age of retirement makes a big difference in your payment calculation. The longer you want to live off your investments, the longer those investments need to last. Ideally, you will have enough principal stashed away to live solely on interest payments, but that’s not always possible. More on that later.

The other reason age of retirement matters is market volatility. The longer you want to live on your retirement funds, the more likely you’ll have to cope with a downturn. Investment accounts take advantage of the fact that, over decades, the markets always rise. In the short term, however, volatility can affect interest rates and monetary value, and significant market volatility can have a significant impact, like a global pandemic affecting the world markets.

Additional Investments and Payments

An IRA and a 401(k) are not the only possible investments you can have for your retirement; they’re just two of the most common.  

When calculating your eventual retirement paycheck, remember to consider additional income streams. 

Two, in particular, are relatively common.

Additional Investments

The first is a pension

A 401(k) is technically a form of pension, but a “traditional” pension operates a little differently. These tend to be most common in major companies and government organizations, and they’re slowly growing less common over time. 

If you have one, you will likely have a fixed payment from a company pension, though you may have the option to cash it out or roll it over to another account so the company doesn’t need to deal with it anymore.

The second is Social Security. Throughout your life and your career, you pay taxes. Some of those taxes go to the government to spend as they will, some go to state governments, etc. Some of it, however, goes towards the Social Security fund. Everyone who works in America pays into Social Security, and everyone who worked in America long enough to earn enough credits is entitled to Social Security when they retire.

Social Security payments typically begin at age 62 and are usually calculated to be roughly 40% of your income level when working. Alternatively, you can delay taking your payments until age 70 to increase the amount you get each year.

Keep these two sources of retirement income in mind. Calculating your desired total retirement income requires considering all of your income streams, not just those from your primary accounts.

401(k) vs. IRA

In the title, we mention 401(k)s and IRAs as the two investment vehicles we will calculate. 

Is there any significant difference between them in retirement?

Traditional IRA vs Roth

The answer is not really. 

There are a lot of differences between IRAs and 401(k)s, but they’re all relevant to investing in them, not taking money from them. Once you reach retirement age, taking money from either of them – or even rolling them together – is acceptable. Either way, you have a principal invested in the markets, which earns interest based on its investment package. You take money from it as required once you retire. How much? Well, that’s the question.

Roth vs. Traditional

One concern is whether your 401(k) or IRA is a Roth account or a traditional account. 

This decision has tax implications which can be relevant to calculating your paycheck in retirement.

With a traditional account, the money contributed to the account is tax-free. When you file your taxes annually, you count the money you put into your investments as a deduction, effectively reducing your overall income and allowing you to invest that money without paying taxes.

Roth vs Traditional

The government always gets its due. When you retire and start withdrawing money from a traditional IRA or 401(k), that money you pull is a paycheck and is taxed as income. You may have to pay income tax on that paycheck, calculated based on your income tax bracket with that new income in retirement. The amount of taxes you’ll have to pay depends on your retirement account type and varies from state to state.

Roth accounts work in the exact opposite way. With a Roth account, the money you contribute comes from your money after paying income taxes on your contributions and is not considered a deduction on your taxes when you earn that money and invest it. However, since you already paid taxes on that money, you don’t have to pay taxes on the disbursements you take when you retire.  

There are ways to roll a traditional account into a Roth account, but they get into more complicated tax strategies that we’re not going to discuss today. If you have a traditional IRA or 401(k), you have to consider income taxes as an additional drain on your retirement paycheck, whereas if you have Roth accounts, you do not.

There’s one other vital factor to consider: the required minimum withdrawal from your accounts. You must take a distribution every year with a traditional retirement account once you hit age 72. With a Roth, you don’t need to take any money out of it. The only requirement is that when you die, your dependents or beneficiary of your inheritance must take the distribution.

How Payouts Work

Once you reach a certain age, you can begin taking distributions from your retirement accounts. Once you reach an even later age, you will be required to do so. As mentioned above, the earliest age you can take money out of a retirement account without penalty is 55 in specific circumstances, or 59 and a half for most people. Once you hit 72, you’ll be required to take payments.

Note: This can change. The age used to be 70 and a half, but it was changed in 2019 under the Setting Every Community Up for Retirement Enhancement (SECURE) Act. It’s possible that, if you’re not already at retirement age, that age can change by the time you reach it. All of these numbers are subject to change based on the whims of the government.

The amount you must take out of your account each year is called the RMD, or Required Minimum Distribution. You can, at any time, take more out of your accounts if you wish, though this is usually a bad idea if it’s not strictly necessary, so we’ll discuss it more in a moment.

How Payouts Work

To quote the IRS:

“The required minimum distribution for any year is the account balance as of the end of the immediately preceding calendar year divided by a distribution period from the IRS’s ‘Uniform Lifetime Table.'”

If you thought that table would be simple, here’s the IRS page for it. This page is over 38,000 words long, so settle in for some serious reading.

Luckily, you can use a simple calculator to estimate how much you will need to take out. The IRS provides one here. For example, if your retirement account has one million dollars in it when you turn 75, you must withdraw $40,650.41 from the account that year. These funds work out to be a monthly income from your account of $3,387.53, though it will be subject to whatever the income tax rate will be when you retire.

Payout Calculator Example

Assuming you have a flat one million in your retirement account is excellent for simple math calculations, but it’s unrealistic. To calculate how much you’ll have in your account at any given age, you will want to use a retirement calculator like this one. By filling in information about your contributions and your investment vehicles, you can estimate how much you’ll be getting paid in your retirement.

The truth is, the amount you earn in retirement will vary by too many factors to offer a simple answer. 

You can also always withdraw more than the minimum to maintain a standard of living you’re comfortable with.

The Dangers of Drawing on Principal

Before we wrap up, one thing to mention is the difference between principal and interest in a retirement account.

The goal of every good retirement plan is to have enough money set aside to live entirely off the interest it provides or near enough as it makes no difference. A sufficiently large investment, placed in a series of investments with high rates of return, will earn enough money each year to cover the minimum disbursement plus any extra you want to withdraw.
If you tap into the principal of the investment, however, your overall total investment value declines.

That gives you less leeway for future payments, but it makes the amount you earn from interest even lower. If you don’t take a lower amount of distribution to compensate, you can enter a cycle of ever-decreasing funds until you, eventually, run out of money.

Dangers on Principal

It’s impossible to say with certainty the threshold for this. You may notice that we’ve given very few numbers throughout this post.

That’s because everyone’s situation will be different. It will vary depending on factors like:

  • Your life expectancy
  • Where your money is invested and what the rate of return is
  • Market performance, which is impossible to predict, especially decades into the future
  • Chances to the tax and legal code that may make the situation better or worse for you
  • Your cost of living and how much money you will need to maintain your standard of living
  • Any medical conditions that will require ongoing treatment and the expenses associated with it

There are too many factors to consider. You can use calculators to estimate the minimum required distribution, but it’s an estimate. You can never know for sure until you’re actually at the moment of taking the money, at which point it’s too late to plan.

It’s always best to start investing as early as possible and invest as much as possible as soon as possible. The more you have in your investments, and the longer they have to grow, the less likely you will need to worry about it when you retire.

FAQ: How Much Cash Should Retirees Keep on Hand?

How Much Cash Should Retirees Keep on Hand

Saving is something many of us do throughout our careers. These savings are often divided between long-term and liquid investments, the latter of which can help pay for immediate expenses. 

General financial advice is to have 3-6 months’ worth of expenses tucked away in savings. The more liquid these funds are, the easier they can be withdrawn for emergencies. These funds can be used to pay for immediate needs, such as vehicles and sudden medical expenses. Alternatively, you can use these funds to cover the ongoing costs of living in the event of a loss of income, giving you leeway to find a new job.

Does this advice still hold once you reach retirement age? Probably not.


  • In retirement, your income drops and stabilizes; you begin to get payouts from your retirement accounts, social security, and similar sources.

  • More importantly, in retirement you no longer have penalties for withdrawing money from your retirement accounts beyond the loss of principal for the still-accumulating growth.

Meanwhile, other expenses can start to ramp up. Medical bills grow more common and more significant as we get older and our bodies wear.

Is having a 3–6-month emergency fund still relevant in this period of our lives? Should you have more cash on hand or less when you can pull from your retirement accounts as needed?

What Does Cash Mean?


Before we dig too deep, let’s take a moment to discuss what “in cash” means. As a retiree, you want to have money accessible when you need it.


Three Forms of Cash


Three forms of “cash” get tossed around interchangeably, but they have slightly different implications.


  1. The first is actual physical cash. Most of the time, no one is advocating keeping cold, hard cash on hand. You may want some physical cash for everyday expenses, particularly if you travel to places where businesses may less commonly accept cards, but that’s pretty minimal these days. Keeping physical cash around was more of a habit for those who lived through the Great Depression, where investments bottomed out. Today, hoarding physical cash can even be risky; plenty of vendors no longer accept cash, preferring to handle everything digitally.


  2. The second is easily accessible savings. A savings account can have money pulled from it whenever you like and is often tied to a debit card for immediate purchasing power. This definition of cash is what most often what people talk about when they mention cash; it’s liquid, not tucked away in an account which you can only access indirectly, and it’s not there to linger and earn interest.


  3. The third is a cash reserve account. Cash reserve investments are generally tied to a currency’s value. These accounts can have interest rates ranging from near-nothing (keeping your dollar value 1:1 with the value of a dollar) or rising in times of economic hardship. Federal reserve rates have sometimes been as high as 5%, offering modest growth while the money is still reasonably accessible.

For today’s post, we’re looking primarily at #2, though #1 also qualifies. The idea is to draw a line between investments that earn interest and cash on hand. You can spend these funds immediately on anything from living expenses, medical bills, and leisure purchases.

Do You Still Need an Emergency Fund?

 
Emergency Fund


The point of an emergency fund is two-fold. 

  1. First, it serves as insulation against hardship. If you lose your income or have a sudden considerable expense, you need to cover it without defaulting on other payments or letting unfortunate events cascade. Losing a job can quickly shift into losing a vehicle or housing if you don’t have funds to keep paying those bills while you search for new income.

  2. The other purpose of an emergency fund is to have money on hand that you can tap into without touching your long-term investments. Before retirement age, if you want to tap into your assets, you can take out a loan against them (and kick the financial hardship can down the road until you have to repay it), or take an early withdrawal and pay a penalty fee for doing so.

Once you reach retirement age, though, do you still need that protection? You don’t need to take a loan against your retirement accounts; you can pull money from them with no penalty. Does it not, then, serve as an emergency fund itself?


Yes. You still want to avoid pulling from your long-term investments for a straightforward reason: growth.


You know by now that the point of long-term investing is to build up as much money as possible in your portfolio so that interest can compound. The more money you have, the more interest makes that money grow. The more interest makes money grow, the more money you have. It feeds back on itself.


When you pull money from your long-term investments, you lose that compounding growth. When you’re pulling out your income in retirement, the idea is for your investment to remain stable for as long as possible; you only pull from interest, so your core investment stays the same, and thus the interest stays the same.


The trouble happens in two ways.


  1. Firstly: tapping into the principal reduces the core amount of money that is earning interest. This reduces the amount of interest, further reducing your regular income. Tapping into your principal can start a dangerous loop, forcing you to reduce your investments until you eventually drain your account.


  2. Secondly: what happens if an economic downturn hits, as it did in 2008, or temporarily in 2020 due to Covid? Interest rates and growth plummeted during these periods. However, you need to keep paying your bills and cost of living. If you’re relying on your investments to pay your way, you have to tap into your principal. If you keep cash around, on the other hand, you can use these funds instead and ride out the financial hardship without worrying about making your investment position worse.

How Much Cash Should You Keep On Hand?


It’s impossible to give general numbers as to how much cash you should keep on hand in retirement. It all comes down to an examination of your expenses. Someone living in a home they own in a rural area in Tennessee will have significantly different costs from someone living in the Bay Area in a rented unit.


To calculate how much cash you should keep on hand, you first need to have a solid idea of your monthly expenses. Maybe you’re spending $3,000 per month on typical living expenses. Perhaps that number is closer to $10,000 for other people. Keep in mind that this number is likely to rise over time. The cost of living keeps going up in 2022, and everything from energy to food to medical care is most likely going to grow more costly.


The second thing you need to know is what other sources of income you may have. Even though you’re retired, you may have additional income streams. 


Cash to Keep on Hand


Income can come in a few forms:

  • If you’ve worked a career that has accrued a pension, that pension will pay out once you retire, with a fixed amount each year. Pensions are less common than they used to be, but they aren’t entirely gone quite yet.
  • Social Security. As a government-managed and public program, social security is a basic income for anyone of retirement age. Some people don’t qualify for social security income – exceptions include a variety of relatively narrow categories of people – but it still provides a consistent, if low, income for most retirees. There’s some doubt whether social security will still be available in a few more decades, but if you’re retiring now, you should have it.
  • Supplementary income.  Many retirees pick up hobbies they can monetize (for example, selling handicrafts online) or pick up a part-time job to have both preoccupation and income. You should count this income as well.


Now that you know how much it costs to live and how much you’re pulling in from various non-investment sources of income, what category do you fall in?
 

  • Under-covered. This scenario is by far the most common position. Your expenses are higher than your income. These expenses are paid with disbursements from your investments.
  • Your income and expenses balance out, so you can leave your investments alone.
  • Over-covered. You make more than enough from your non-investment sources; you don’t need to worry about running out of money right away.


Generally, it would help to calculate your necessary cash on hand based on the discrepancy between income and expenses. 


For example, suppose that your costs of living sum up to $7,500 per month. Your income covers a little under half of your expenses, leaving $4,000 per month to come from somewhere else, typically your investments. 


Let’s say you have $2,000 per month in a pension, $1,000 per month in social security, and $500 per month in part-time income.


Expenses Calculation


To calculate your emergency fund, decide how many months you want to be covered. Pre-retirement, the general recommendation is 6-12 months. In retirement, opinions differ. Some financial advisors say 12-18 months, while others say 24+ months. 


Consider this: the larger your cash on hand, the more insulated you will be from economic hardship by adjusting your investments. The markets can take between 6 and 18 months (or sometimes longer) to recover from a downturn, so you want at least that much set aside to pay expenses to avoid tapping into your investments which you’d be selling for a low value.


Moreover, different investment portfolios may take more or less time to recover. An investment made of half stocks and half bonds, for example, can take up to 40 months to fully recover from a downturn. 


In our example, with $4,000 per month in expenses not covered by a stable income, you would want:

  • Twelve months of coverage, or $48,000 in cash on hand.
  • Eighteen months of coverage, or $72,000 in cash on hand.
  • Twenty-four months of coverage, or $96,000 in cash on hand.


So, somewhere between $50,000 and $100,000 is the right number in this hypothetical scenario. Your numbers will vary quite a bit depending on your unique living situation.

Just because you retired doesn’t mean you want to cash out all of your investments. Long-term investments can continue to grow as long as you have the luxury to let them. You never know how long you’re going to live after retirement or what unexpected expenses mar arise. 


You want your investments to stay as large and as stable as possible for as long as possible and only tap into them in the case of an unavoidable emergency.


Remember, as well, that you may have other sources of funds in an emergency. You may be able to leverage a home equity line of credit, the funds in a Health Savings Account, or other credit lines if you need them before tapping into your retirement accounts. 

Using Your Best Judgment


No one can predict what the markets will do. Over the long run, historically, they’ve gone up. Once you hit retirement age, you can no longer rely on long-term recovery from short-term downturns. To avoid financial hardship, it would help if you found the right balance of income and savings from various sources to insulate yourself from downturns.


Use Your Best Judgement


Everyone’s financial situation is unique. The best you can do is create a plan based on what you know and make the best judgment about your future. It may be worth talking to a financial advisor directly, considering all of the unique factors in your life. 


Are you close to retiring, or have you already retired? What is your primary intention for wanting to keep cash on hand? Do you have any questions for us on maintaining your retirement funds and maintaining an emergency cushion that you can access quickly? Please share with us in the comments section, and we’ll get back to you with a thoughtful answer to point you in the right direction!

Next Lesson

Can You Contribute to Multiple 401(k) Accounts Simultaneously?

Contribute to Multiple 401k

The humble 401(k) is among the most popular forms of retirement account. It is typically employer-sponsored and often includes employer matching (to a point), allowing retirement funds to ramp up faster than other investment vehicles simply due to the additional influx of cash.

Before 1974, a few U.S. employers had been giving their staff the option of receiving cash in lieu of an employer-paid contribution to their tax-qualified retirement plan accounts. The U.S. Congress banned new plans of this type in 1974, pending further study. After that study was completed, Congress reauthorized such plans, provided they satisfied certain special requirements. Congress did this by enacting Internal Revenue Code Section 401(k) as part of the Revenue Act. This occurred on November 6, 1978.” – Wikipedia.

Though this form of retirement plan didn’t become popular until the 80s, it is now one of the most common plans available due to its benefits for employers and employees. Most companies that offer retirement benefits do so through a 401(k) plan today.

In the past, careers were stable. You could get a job and reasonably expect to work for that company for decades and possibly keep that same career to your retirement. Retirement parties were a common sight.

Today, company loyalty is at an all-time low, with many people job-hopping every 2-3 years. Companies often fail to provide avenues for advancement or raises, even to counteract the cost of living, so changing companies is often seen as the only way to progress in a career.

There are a ton of repercussions to this shift in employment culture, but one that many people overlook is the retirement plan. If you’re hired on to a company that offers a 401(k), and you work for them for three years, great! You have three years of contributions to your retirement account.

What happens if you leave the company and go to another that also offers a 401(k) plan? Chances are they’re with various brokerages or use different asset distributions. They open a new 401(k) for you, but your old one still exists.

Can you have two 401(k) plans legally? Can you contribute to both of them? Are there any salient details you should know?

Let’s dig in and find out.

Are There Legal Restrictions on Multiple 401(k)s?

First of all, there’s no legal restriction against having multiple 401(k) accounts. You can have multiple 401(k) accounts from W-2 employers, or you can have both an employer-sponsored 401(k) and an individual 401(k) as suits your needs.

  Legal Restrictions on Multiple 401ks

It’s pretty typical for people to have more than one 401(k). There are no laws or regulations against it. If you change jobs, you can keep your old 401(k), roll it over into your new account, consolidate it, or even take a payout.

However, there is one restriction: your old 401(k) needs to have at least $5,000 in it to maintain it. If it has less than that amount of money, the employer is entitled to shuffle that money around, often rolling it into an IRA. If your old 401(k) has less than $1,000, they will cash it out and send you a check.

The other limitation is that you cannot contribute to an old 401(k) from an employer you no longer work with. You can’t tell your new employer to contribute to your old account, nor can you contribute to it; after all, your old employer has no real incentive to help you with your retirement; they’re not allowed to do anything with those funds other than continue to manage them.

How to Contribute to More Than One 401(k)

So, wait. If you can’t contribute to an old employer’s 401(k), how can you contribute to more than one 401(k)? There are two options.

The first is having an employer 401(k) and an individual 401(k).

Individual 401(k)s are only available to people who have their own companies or are self-employed. Individuals with self-employment income and people who have C corps, S corps, or LLCs and no employees can create their 401(k) plans.

Contribute to More Than One 401k

The individual 401(k) is unique in that the contribution limits are higher because you can “match” your contributions as both the employee and the business owner; you can “match” your contributions. This strategy isn’t “free” money the way an actual employer match is – since you’re contributing both sides, rather than one side coming from a company – but it effectively allows you to have a much higher contribution limit than a standard 401(k).

The second option is to have more than one job.

If you work two jobs, and both of them offer 401(k) plans to their employees, you are free to have both. In some cases, this can be a good idea because it allows you to access different asset mixes and funds and accrue more employer matching above the contribution limits.

What are The 401(k) Contribution Limits?

There are two relevant 401(k) contribution limits you need to know.

The first is the individual contribution limit. This contribution limit is a limitation that applies to all 401(k)s. In 2022, that limit is $20,500.

A 50/50 split means each 401(k) would support up to $10,250 and not a penny more. So, if you have one 401(k), you can contribute up to $20,500 to it. If you have two 401(k)s, you can contribute up to $20,500 to all accounts combined.

The distribution can vary. If you want to put $20,000 in one 401(k) and $500 in the other, you can do so. It would be best if you simply made sure neither employer over-funds your accounts through automatic contributions. If you over-contribute, you may be subject to additional taxes on the excess, and you’ll be required to remove the extra contributions, paying the 10% early withdrawal penalty. In general, over-contributing is penalized and isn’t worth trying to do.

Contribution Limit #1

There’s a second contribution limit, though, and it’s the most exciting. It’s the employer contribution limit. This limit, as of 2022, is $61,000. 

There’s one quirk, however. This limitation is calculated per employer rather than per employee.

In other words, both of your employers can potentially contribute up to $61,000 to your 401(k)s. If you work two jobs and have two employers, and all three of you max out your contributions, that’s $20,500 + $61,000 + $61,000.

Employer contributions are usually based on a percentage of the employee’s salary and contributions, carefully calculated to be as minimal as possible while still compelling to the employee. Very few companies will max out contributions for most of their employees. However, that’s a more social and political discussion than a legal one.

If you’re using an individual 401(k) as a self-employed person with a day job, you can contribute to both the employer and employee side of your individual 401(k). 

Contribution Limit #2

Imagine a scenario such as this:


  • You work a W-2 job with 401(k) matching, dollar for dollar, up to your contribution limit.
  • You have a lucrative LLC on the side.

You have three relevant values here:


  • You can contribute as your LLC by up to $61,000.
  • Your individual contribution limit is $20,500.
  • Your W-2 employer will match up to $20,500.

That means you can potentially have $102,000 added to your 401(k)s throughout the year. 

If your W-2 employer wanted, they could even contribute more, up to that $61,000 amount, though it’s relatively unlikely to happen.

This practice is perfectly legal; you simply need the funds to supply the account from your LLC.

Remember, too: if you’re over 49 years old, you can add “catch-up contributions” on top of your other contributions; the limits are higher for older people to better take advantage of a limited number of years of compounding interest.

Before we continue, there’s one more quirk you should be aware of: employee vesting. When you sign up for a retirement plan with an employer, they will usually have a clause about “vesting” in the employer contributions.

Vesting is partial ownership of the money the employer invests in your account. If an employer has, say, 20% per year vesting, it will take five years for you to be entitled to the total amount the employer has contributed. 

This contribution limit is essentially a way for an employer to avoid paying into an employee’s account, only to have that employee leave after 1-2 years and take the money with them. While most of the time, this wouldn’t be valuable to do anyway, some specific businesses and industries have excellent retirement benefits. Thus, vesting rules prevent it. It would be beneficial to do so.

In practice, what this means is that if you leave an employer before you are fully vested in their 401(k) contributions, they can keep some percentage of the money – the percentage you weren’t invested in. This limitation can be a rude awakening if you roll over an old 401(k), only to find that some portion of the value doesn’t come with you.

What to Do with Multiple 401(k)s

Suppose you find yourself in a situation where you have more than one 401(k). What should you do? What’s the correct move financially?

The truth is, there’s no one correct answer. Your best bet is to talk to a financial advisor directly. However, we can offer some general advice and scenarios.

What To Do With Multiple 401k Accounts

If you left a job with a 401(k) and you started a new career with a 401(k), you generally want to do something with the old 401(k). There are several reasons for this.

  • If the value is too low, under $1,000, the employer will cash out the old 401(k) in your name, and you will be subject to a penalty for early withdrawal.
  • If your old 401(k) value is under $5,000, the employer is not required to keep a handle on it and can force you to roll it over or otherwise claim it.
  • Since IRAs and 401(k)s are different accounts, they are subject to additional rules, asset mixes, and management practices. If you leave the retirement account alone, your employer will likely roll it over into an IRA for you to manage on your own. After all, the employer doesn’t want to manage your money when you no longer work for them.
  • If the old employer goes bankrupt or collapses, it can be challenging to track down and claim the money in the old account, especially years after the fact. Of course, you’re entitled to it, but getting ahold of it can be challenging and frustrating.

Generally, the best option is to roll over your old 401(k) into your new one, so your interest keeps compounding. There are occasionally good reasons to leave your old 401(k) in place, such as taking advantage of limited investment vehicles. Again, though, talk to a financial advisor about your specific situation.

Remember that you can’t contribute to a 401(k) managed by an employer you no longer work for. While they may be required to keep managing the money if it’s over $5,000, they are not required to allow you to pay into the account.

On the other hand, if you have two 401(k)s because you’re self-employed, you can use the contributions from the employer site to invest more than you “should” be able to invest. Careful management of employer matching with your W-2 job, plus maximizing your contributions as an LLC, can be a compelling way to save more for retirement.

Summing Up

To sum things up in brief:

  • Yes, you can have more than one 401(k) account.
  • Yes, you can contribute to more than one 401(k) account if you actively work for two employers (even if one of those employers is yourself).
  • Your individual contribution limit is shared across all 401(k) accounts, and you will be subject to taxes and penalties if you over-contribute.

Depending on your specific situation, there are a few potential benefits to having more than one 401(k). Still, you would do best to talk to a financial advisor directly about your particular circumstances to get the best advice.

Summing Up

Do you have multiple 401k accounts, or are you thinking of opening one? Are you worried about hitting contribution limits? Have you had trouble rolling over your 401ks, or are you worried you’re doing something incorrectly? Please share with us in the comments below, and we’ll do our best to point you in the right direction!

Next Lesson

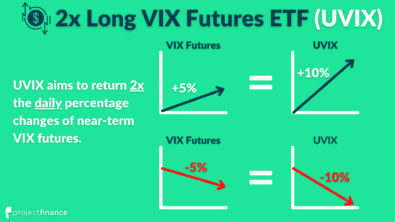
What is UVIX? (2x Long Volatility ETF Explained)

Volatility has become a tradable asset class due to the success of volatility ETPs such as VXX, SVXY, and UVXY.

UVIX is one of the newest products entering the volatility trading space, restoring the 2x leveraged long volatility exposure that UVXY once had.

What is UVIX and How Does it Work?

The Long VIX Futures ETF (Ticker: UVIX) seeks to provide daily investment results, before fees and expenses, that correspond to 2x the Long VIX Futures Index (Ticker: LONGVOL).

UVIX is the 2x Long VIX Futures ETF, returning 2x the daily percentage change of a portfolio composed of first and second-month VIX futures.

The inception date of UVIX is scheduled to be March 30th, 2022. Volatility Shares is the issuer of UVIX.

Let’s explore the Long VIX Futures Index mentioned in the product description to learn how UVIX works.

What is the Long VIX Futures Index (LONGVOL)?

The benchmark UVIX tracks is the Long VIX Futures Index (LONGVOL) by Cboe.

Index Methodology: LONGVOL tracks the daily performance of a theoretical portfolio of first and second-month VIX futures contracts that are rolled daily. The portfolio aims to hold a mixture of the two futures to achieve a weighted average of 30 days to settlement.

If it is February 1st, the first-month VIX future will be the February contract, and the second-month VIX future will be the March contract.

VIX futures track the Cboe Volatility Index (the VIX Index), which increases during times of heightened market volatility and falls during calm market periods.

A long VIX futures position profits when the:

  • VIX index increases to higher levels, pulling VIX futures contracts up along with it.

  • VIX futures curve is in backwardation, causing short-term futures to drift higher as they converge towards the higher VIX index.

The LONGVOL index will therefore increase during rising or persistently high volatility market conditions where VIX futures are in backwardation.

Bullish UVIX traders are effectively long Cboe volatility index futures.

Bearish UVIX traders are effectively short Cboe volatility index futures.

LONGVOL Movement Examples

The past performance of the LONGVOL index informs us about how UVIX should perform under various market conditions:

During extended periods of low volatility, UVIX will lose substantial value driven by consistent contango in the VIX futures market, leading to decaying near-term VIX Futures.

VIX Contango: The Ultimate Beginner’s Guide

Consequently, the share price of UVIX will decay immensely, as LONGVOL did during the persistently low volatility of 2016. Here is LONGVOL during the first few months of 2016:

From February 2016 to June 2016, LONGVOL fell from 7,600 to around 3,600, a decrease of over 50%. UVIX would have experienced an even worse decline, as it tracks 2x the daily percentage change of LONGVOL.

But during periods of surging market volatility, UVIX will gain significant value. The faster the increase in volatility, the larger the increase UVIX will experience.

Here’s what LONGVOL did in early 2020:

Source: Cboe

If you’re familiar with UVXY, it used to have 2x long volatility exposure like UVIX. After the “volmageddon” of 2018, UVXY’s leverage was reduced from 2x to 1.5x.

UVIX is the new 2x long volatility product, restoring the previously accessible 2x leverage to the long volatility product space.

While UVIX may experience exponential returns during periods of rapidly increasing or persistently high volatility, the long-term trend in UVIX will be down as VIX futures are in contango a majority of the time during normal market conditions.

What is the Difference Between VIX and UVIX?

The VIX cannot be traded directly. UVIX allows positive leveraged exposure to changes in the VIX index through the VIX futures market.

The Cboe VIX Index is a calculation of market implied volatility using S&P 500 Index options with around 30 days to expiration.

The VIX index cannot be traded as there are no underlying shares. It is only a calculation.

To trade anticipated changes in the VIX index, traders turn to VIX futures and options.

Trading VIX futures is a risky endeavor, as one VIX futures contract represents $1,000 per point in notional value (a large position). A 10-point move in a VIX futures position translates to a P/L of $10,000 on one contract.

UVIX is an ETF that tracks the LONGVOL index, which tracks 2x the single-day percentage changes of the first and second-month VIX futures contracts.

For instance, if it is February 1st, LONGVOL will track 2x the single-day percentage changes of a mixed portfolio of February and March VIX futures contracts.

UVIX is a volatility product that allows traders to gain leveraged exposure to changes in the VIX index through the futures market.

VIX Index <= VIX Futures <= UVIX

What is the Difference Between UVIX and SVIX?

UVIX, the 2x Long VIX Futures ETF, seeks to provide daily investment returns, before fees and expenses, that correspond to twice the performance of the Long VIX Futures Index (LONGVOL).

UVIX is a 2x leveraged long volatility product.

UVIX aims to return 2x the daily percentage change of a portfolio consisting of first and second-month VIX futures contracts.

SVIX, the Short VIX Futures ETF, seeks to provide daily investment returns, before fees and expenses, that correspond to the performance of the Short VIX Futures Index (SHORTVOL).

SVIX is a short volatility product.

SVIX aims to return -1x the daily percentage change of a portfolio consisting of first and second-month VIX futures contracts.

Read our full guide on SVIX.

How Risky is UVIX?

UVIX is a high-risk leveraged volatility product.

UVIX should not be held as a long-term “investment.” Buying shares of UVIX does not represent ownership of any business, unlike buying shares of SPY.

During calm market periods where the VIX futures are in contango, UVIX will lose value steadily from the decaying VIX futures.

The investment strategy of holding UVIX during low market volatility with the anticipation of increasing market volatility is not easy.

In the event of a short-term volatility spike, UVIX can gain significant value, but over time, it should trend towards zero.

UVIX is designed for short-term stock and options trading, not long-term “investing.” It is incredibly expensive to hold long volatility positions constantly, as VIX futures lose value when in prolonged periods of contango.

Additionally, the complex nature of UVIX can cause uninformed traders to lose money due to a lack of understanding of the product’s mechanics.

I do not recommend making any trades in UVIX unless confident in your understanding of how it works, and the risks of your specific trades.

How is UVIX Calculated?

UVIX is benchmarked to the Long VIX Futures Index (LONGVOL).

LONGVOL tracks the daily performance of a theoretical portfolio of first and second-month VIX futures contracts that are rolled daily.

Each day, the net asset value (NAV) of UVIX should correspond to:

Previous Closing Price + 2x the Current Trading Day’s LONGVOL Change (%)

Example: UVIX closes at $50 on Monday.

On Tuesday, if the LONGVOL index increases by 3%, UVIX shares should trade 6% higher at $53 ($50 x 1.06).

Conversely, if the LONGVOL index falls by 10%, UVIX shares should fall 20% to $40 ($50 x 0.80).

The above examples represent no tracking error (perfect tracking of index performance). In reality, exchange-traded products can experience tracking error.

Source: UVIX Prospectus (p.36)

Is There Options Trading on UVIX?

UVIX is a brand new product (inception date of March 30th, 2022) and does not yet have a liquid options market. Time will tell if the options market in UVIX improves.

Does UVIX Pay a Dividend?

No, UVIX does not pay a dividend.

Additional Resources

Chris Butler portrait

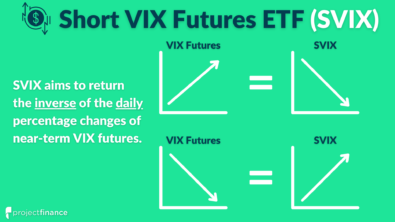
What is SVIX? (Short Volatility ETF Explained)

Volatility has become a tradable asset class due to the success of volatility ETPs such as VXX, SVXY, and UVXY.

SVIX is one of the newest products entering the volatility trading space.

What is SVIX and How Does it Work?

The -1x Short VIX Futures ETF (Ticker: SVIX) seeks to provide daily investment results, before fees and expenses, that correspond to the Short VIX Futures Index (Ticker: SHORTVOL).

The inception date of SVIX is scheduled to be March 30th, 2022. Volatility Shares is the issuer of SVIX.

Let’s explore the Short VIX Futures Index mentioned in the product description to learn how SVIX works.

What is the Short VIX Futures Index (SHORTVOL)?

The benchmark SVIX tracks is the Short VIX Futures Index (SHORTVOL) by Cboe.

Index Methodology: SHORTVOL tracks the daily inverse performance of a theoretical portfolio of first and second-month VIX futures contracts that are rolled daily. The portfolio aims to hold a mixture of the two futures to achieve a weighted average of 30 days to settlement.

If it is February 1st, the first-month VIX future will be the February contract, and the second-month VIX future will be the March contract.

VIX futures track the Cboe Volatility Index (the VIX Index), which increases during times of heightened market volatility and falls during calm market periods.

A short VIX futures position profits when the:

  • VIX index falls to lower levels, pulling VIX futures contracts lower with it.

  • VIX futures curve is in contango, causing short-term futures to trade lower as they converge towards the lower VIX index (contango bleed).

The SHORTVOL index will therefore increase during falling or persistently low volatility market conditions.

Bullish SVIX traders are effectively short Cboe volatility index futures.

Bearish SVIX traders are effectively long Cboe volatility index futures.

SHORTVOL Movement Examples

The past performance of the SHORTVOL index informs us about how SVIX should perform under various market conditions:

During extended periods of low volatility, SVIX can increase exponentially as it captures continuous positive daily percentage returns from the decaying VIX futures.

Consequently, the share price of SVIX can compound, as SHORTVOL did during the persistently low volatility of 2016 and 2017:

From January 2016 to January 2018, SHORTVOL went from the low 300s to 2,800, an increase of 833%. SVIX would have experienced a similar return.

But during periods of surging market volatility, SVIX will likely lose substantial value. The faster the increase in volatility, the larger the drawdown SVIX will experience.

In early 2018, the popular short volatility ETF, SVXY, lost over 90% of its value after market volatility spiked:

Source: Google Finance

The short volatility product XIV was terminated following the collapse. SVXY’s leverage was reduced from -1x to -0.5x.

SVIX is the new -1x volatility product, restoring the previously accessible -1x leverage to the short volatility product space.

While SVIX may experience exponential returns during prolonged periods of low volatility, all of its value can be lost in the event of a massive short-term spike in volatility.

What is the Difference Between VIX and SVIX?

The VIX cannot be traded directly. SVIX allows inverse exposure to changes in the VIX index through the VIX futures market.

The Cboe VIX Index is a calculation of market implied volatility using S&P 500 Index options with around 30 days to expiration.

The VIX index cannot be traded as there are no underlying shares. It is only a calculation.

To trade anticipated changes in the VIX index, traders turn to VIX futures and options.

Trading VIX futures is a risky endeavor, as one VIX futures contract represents $1,000 per point in notional value (a large position). A 10-point move in a VIX futures position translates to a P/L of $10,000 on one contract.

SVIX is an ETF that tracks the SHORTVOL index, which tracks -1x the single-day percentage changes of the first and second-month VIX futures contracts.

For instance, if it is February 1st, SHORTVOL will track -1x the single-day percentage changes of a mixed portfolio of February and March VIX futures contracts.

SVIX is a volatility product that allows traders to gain exposure to changes in the VIX index through the futures market.

VIX Index <= VIX Futures <= SVIX

What is the Difference Between UVIX and SVIX?

UVIX, the 2x Long VIX Futures ETF, seeks to provide daily investment returns, before fees and expenses, that correspond to twice the performance of the Long VIX Futures Index (LONGVOL).

UVIX is a 2x leveraged long volatility product.

UVIX aims to return 2x the daily percentage change of a portfolio consisting of first and second-month VIX futures contracts.

Read our full guide on UVIX.

SVIX, the Short VIX Futures ETF, seeks to provide daily investment returns, before fees and expenses, that correspond to the performance of the Short VIX Futures Index (SHORTVOL).

SVIX is a short volatility product.

SVIX aims to return -1x the daily percentage change of a portfolio consisting of first and second-month VIX futures contracts.

How Risky is SVIX?

SVIX is a high-risk volatility product.

SVIX should not be held as a long-term “investment.” Buying shares of SVIX does not represent ownership of any business, unlike buying shares of SPY.

During calm market periods where the VIX futures are in contango, SVIX will gain value steadily.

The investment strategy of holding SVIX shares during low market volatility can produce incredible returns, but not without the risk of catastrophe.

In the event of a short-term volatility spike, SVIX can lose all or most of its value, as XIV and SVXY did during the “volmageddon” in 2018.

SVIX is designed for short-term stock and options trading, not long-term investing.

Additionally, the complex nature of SVIX can cause uninformed traders to lose money due to a lack of understanding of the product’s mechanics.

I do not recommend making any trades in SVIX unless confident in your understanding of how it works, and the risks of your specific trades.

How is SVIX Calculated?

SVIX is benchmarked to the Short VIX Futures Index (SHORTVOL).

SHORTVOL tracks the daily inverse performance of a theoretical portfolio of first and second-month VIX futures contracts that are rolled daily.

Each day, the net asset value (NAV) of SVIX should correspond to:

Previous Closing Price + Current Trading Day’s SHORTVOL Change (%)

Example: SVIX closes at $50 on Monday.

On Tuesday, if the SHORTVOL index increases by 3%, SVIX shares should trade at $51.50 ($50 x 1.03).

Conversely, if the SHORTVOL index falls by 10%, SVIX shares should fall to $45 ($50 x 0.90).

The above examples represent no tracking error (perfect tracking of index performance). In reality, exchange-traded products can experience tracking error.

Source: SVIX Prospectus (p.36)

Is There Options Trading on SVIX?

SVIX is a brand new product (inception date of March 30th, 2022) and does not yet have a liquid options market. Time will tell if the options market in SVIX improves.

Does SVIX Pay a Dividend?

No, SVIX does not pay a dividend.

Additional Resources

Chris Butler portrait

Money 101: The Functions & Characteristics of Money

Money is at the core of almost everything we do.

Unless you live in the wild and fully support yourself, you use money.

In this guide, you will deepen your understanding of money by exploring the:

  • Functions of money
  • Characteristics of money
  • Evolution of money

Let’s begin!

What is Money?

According to the Merriam-Webster definition, money is generally accepted as a medium of exchange, a measure of value, or a means of payment.

So “money” is:

– Recognized by society as being an acceptable form of payment for things

– People can value goods/services in terms of money

The combination of these things means:

#1: I can walk into a U.S. grocery store and buy food with U.S. dollars, the recognized and acceptable form of currency in the United States.

#2: I can assess how valuable things are by comparing their values in a common unit of measurement (if a bottle of wine is $20, and a car is $20,000, I know the car is more valuable than the bottle of wine).

But it wasn’t always like this.

Thousands of years ago, the barter system (trading goods for goods) was the primary method of exchange.

If I made pots and you made blankets, I could trade you a pot for a blanket:

Goods/Services ⇒ Goods/Services

The barter system is inefficient because of the double coincidence of wants. For a trade to happen, each person must want what the other has to offer.

This is where modern money came to save the day.

By having a common thing that society recognizes, values, and demands, trade can occur between two parties even if they don’t want the goods/services the other has to offer.

We call the collectively recognized and valued thing money.

What Does Money Really Represent?

One of the most profound things I’ve come to understand about money is it is effectively stored energy.

Money we earn represents our life/labor energy.

We spend time and energy working to earn money to spend, save, or invest.

We convert our time and energy into money that we can later convert into a good or service.

Time and Energy Spent Working ⇒ Money ⇒ Goods/Services

Throughout history, money has taken many forms: shells, salt, sticks, stones, coins, paper, and now, digital money like digital USD and bitcoin.

The specific types of money have evolved over thousands of years as better forms of money emerged.

What makes a form of money better than another? We will explore that shortly.

The 3 Functions of Money

Regardless of the form of money (gold coins, paper notes, bitcoin) there are three primary functions of money:

  • Medium of Exchange

  • Store of Value

  • Unit of Account

Let’s explore each of these money functions with examples.

Medium of Exchange

The first function of money is a medium of exchange, or a common item that people use to carry out transactions.

Example: I go out to dinner and pay the restaurant U.S. dollars (USD) for my food.

Money (USD) ⇒ Dinner

The restaurant takes my dollars and pays their suppliers for ingredients and staff for serving me.

Money (USD) ⇒ Restaurant Supplies + Payroll

The staff takes their dollars and exchanges them for food, clothes, and shelter.

Money (USD) ⇒ Food, Clothes, and Shelter

Having a medium of exchange makes trade much more efficient because I can pay someone money for goods/services, which they accept because they know someone else will accept that same money for goods/services (money has constant demand).

If the people in a society all recognize and value a common medium of exchange, those people pay and receive payment in that medium of exchange.

In the United States, the recognized medium of exchange is the U.S. Dollar (USD).

In the eurozone, the recognized medium of exchange is the euro.

In El Salvador, the recognized mediums of exchange are USD and bitcoin.

Store of Value

The second function of money is serving as a store of value (preserving value across time).

The benefit of having a store of value is that we don’t have to spend our money immediately if we have no wants or needs.

With no immediate wants or needs, we can save or invest our money to spend it in the future by holding it in a store of value.

Without a store of value, we have to spend our money immediately, even if we don’t have anything we need to buy. Without a store of value, we increase wasteful spending and can’t save for the future.

Ideally, money serves as a store of value by preserving purchasing power over time. As we’ll see in a later section, this hasn’t been the case for modern money over long time periods.

What Makes a Good Store of Value?

A good store of value will preserve (or grow) purchasing power over time.

Purchasing power is how much stuff I can buy with my money.

If $100 in my bank can buy 100 widgets today and 100 widgets a year from now, the money holds its purchasing power and is a fantastic store of value.

Stable/Growing Purchasing Power Over Time ⇒ Great Store of Value

If $100 in my bank can buy 100 widgets today but only 50 widgets a year from now, the money loses purchasing power and is not a store of value.

Loss of Purchasing Power Over Time ⇒ Bad Store of Value

The store of value function is critical to the success of a form of money.

If a money does not hold its purchasing power over time, its users are encouraged to spend their money sooner than later because they will be able to buy less in the future compared to now. Rapid loss of purchasing power prevents people from saving money for future consumption.

Additionally, those selling goods/services may be hesitant to accept something that doesn’t hold its purchasing power over time.

For instance, if I I’m selling a $1,000 item, I’ll be hesitant to accept $1,000 worth of bananas instead of $1,000 in gold.

The bananas will perish within a week and render the entire sale worthless.

The gold doesn’t spoil, and I can hold it comfortably for an extended period of time. It may even appreciate!

Unit of Account

The third function of money is acting as a unit of account (common measure of value).

With a common unit of measurement, we can easily track changes in wealth and compare the prices of goods/services.

If a cup of coffee is $5 and a bottle of wine is $100, I know the bottle of wine is more valuable than the coffee.

But if the coffee is $5 and the bottle of wine is 100 shells, it’s not clear which item is more valuable because the measure of value is different.

This is why it’s confusing traveling to foreign countries: they have a different unit of account than you’re used to, making it hard to understand the value of things. Is 10,000 yen a lot of money? How much are 25 pesos worth in USD? Confusing!

We’ve now explored how money serves as a:

  • Medium of exchange
  • Store of value
  • Unit of account

Technically, anything can be money, so what explains why money has changed forms so many times over the millennia?

The 8 Characteristics of Money

A new form of money should be graded on a basket of characteristics.

Something with high grades in all money characteristics is a better form of money than something with high scores in only a few of the characteristics.

The market will ultimately choose the best form of money—the one with the highest cumulative ranking in all characteristics of money.

What are these characteristics?

Durable

Money that is durable (difficult to destroy) is safer to possess than fragile money. Durability exists in a physical and digital sense.

Wine glasses would be a poor form of money because they are fragile. If your wealth is stored in wine glasses and a bulldozer drives over them, you’re toast.

Gold is virtually indestructible (A+ durability), which is one reason it has stood the test of time as a widely recognized store of value.

If your house was burning down, it would be better to have bars of gold under your mattress as opposed to piles of dollar bills.

Gold is, therefore, more durable than paper money.

Durability exists in a digital sense too.

For example, bitcoin has no physical form, but it is incredibly durable. So how can digital money be durable?

Bitcoin is entirely digital money requiring the entire history of transactions to keep track of who owns what.  If the entire bitcoin ledger (transaction history) was stored on a single computer, the wealth of every user could be erased by destroying the computer storing the ledger (no history of transactions = no way to verify ownership).

Fortunately, the bitcoin ledger is stored and updated on a global computer network consisting of tens of thousands of computers.

Simultaneously destroying every computer storing bitcoin’s transaction history is virtually impossible, making bitcoin highly durable.

Fungible

Money needs to be fungible, or interchangeable with other identical units without loss of value.

Government-issued currencies are highly fungible because it doesn’t matter which $1 bill you have.

If I have $1 and you have $1, we can exchange the notes and be in equal standing.

When gold and silver coins were used as currency, fungibility would be a problem in a scenario where my gold coin was 95% pure while your gold coin was 90% pure. I wouldn’t want to give you my 95% gold coin for your 90% gold coin, even if they were marked the same and supposed to be of equal value.

Even if the coins were marked similarly and said to be equal, they wouldn’t be fungible because of the differing purities. Additionally, early forms of precious metal coins likely differed in shape and size, decreasing fungibility.

If various “identical” units of money are deemed more valuable than others, the money becomes less acceptable than a fully fungible form of money and will not move as freely through the economy.

Divisible

Money that is highly divisible allows for accurate payments of any value.

Without divisibility:

  • Value is lost through inaccurate exchanges.

  • Small exchanges don’t happen at all

For instance, if our minimum denomination was $5, I could not accurately pay for something worth $7. I’d have to pay $10 and overpay by $3 or the merchant would have to accept $5 and lose $2.

U.S. currency is divisible because each $1 consists of 100 units called pennies.

Bitcoin is divisible because each unit is divisible into 100 million units called satoshis (sats).

It doesn’t matter if a good is worth $1.23 or 0.0003 BTC, I can pay the exact amount because U.S. dollars and bitcoin are highly divisible.

Portable

Money must be portable so that it can move around easily.

A gold bar is not very portable because it’s big and heavy. Not to mention it’s not very divisible either! Therefore, a gold bar is not great day-to-day money.

The introduction of paper currencies convertible to gold made money more portable because paper is light and flexible. It’s easier to carry around a piece of paper that represents $100 in gold than $100 in physical gold.

Today, money is more portable than ever because it is mostly digital.

Portability doesn’t only involve moving money physically, but how easily it can move across borders.

Digital USD is portable within the USA, but less so internationally. There are restrictions on where I can send USD in the world, and it may take days.

Bitcoin is digital and borderless. BTC can be sent anywhere in the world without permission from financial gatekeepers.

Therefore, digital USD is highly portable within the USA but is less portable than BTC in terms of sending global payments.

Verifiable

Money must be verifiable to become counterfeit-resistant.

If the authenticity of money cannot be verified, the potential for counterfeit increases.

Government-issued currencies are verifiable from the serial numbers and intricate markings that appear on each unit of currency, providing them with strong counterfeit-resistance.

Bitcoin cannot be spent without access to the private key associated with a bitcoin wallet. Bitcoin’s ledger, or history of transactions, is public, making it easy to verify any transaction.

Scarce

Scarcity is a critical characteristic of money because it is essential to the value of money over long periods of time. Everything that is valuable is scarce.

Your life is valuable because it has a time limit.

The Flying Fox yacht is valuable because there are few 450-foot luxury yachts in the world.

Gold is scarce because we must go through the time-intensive and costly process of digging it out of the ground.

Scarcity is essential to the preservation of value over time.

Limited supply and/or costly production improve scarcity.

Resistant to Confiscation and Censorship

Lastly, money should be resistant to confiscation (theft) and censorship (control of how money is used).

If a money is easy to confiscate, people are not safe storing their wealth in it.

After all, money represents our blood, sweat, and tears. If our money is confiscated, our life energy is stolen. Similarly, if our payments can be censored, we aren’t free to spend our money how we’d like to.

Different forms of the same money can be more or less resistant to confiscation and censorship.

For example, physical dollars can easily be stolen by a thief, which is why most people store their money at commercial banks and access it digitally.

Physical money is censorship-resistant because only the carrier of physical money can choose how it is spent/moved.

Digital dollars are much harder to steal, but are much less resistant to censorship (a bank can reject a credit card payment or wire transfer).

The Acceptability of Money

The characteristics of money make it more acceptable.

Money is the most “salable” good in an economy, or the easiest to sell.

Why? Everyone wants money because they can use it for anything.

Since money is highly demanded, it’s easy to sell (which is what you do when you buy something).

A money ranking high in all money characteristics will be more demanded than a money ranking poorly in the money characteristics.

Example: a form of money that is durable, scarce, divisible, portable, and verifiable will be more salable/demanded/acceptable than money that has low rankings in these characteristics.

Commodity Money vs. Representative Money vs. Fiat Money

Money has evolved over many thousands of years.

In the past, commodity money was the norm, which is money that derives value from its material, such as gold and silver coins.

Commodity money like gold and silver coins have intrinsic value because gold and silver are valuable.

Commodity money is inherently lacking in portability, verifiability, and fungibility. It’s inefficient to carry around a pouch of precious metals (not portable), they can be counterfeited (difficult to verify) and come in varying shapes and sizes (not fungible).

To improve the characteristics of commodity money, the world introduced representative money, which is money that is backed by something, such as gold.

An example of representative money would be a currency note convertible to a specified amount of gold.

Instead of carrying around gold coins, people could carry around paper notes representing convertibility to gold coins, increasing portability, verifiability, and fungibility.

Paper notes convertible to gold was the case under the gold standard.

Eventually, fiat money became the global standard, which is money that derives its value from government order.

A $20 bill (USD) is an example of fiat money. It has no intrinsic value because it’s only a piece of paper. But a $20 bill is valuable because the government says it has value, and it is legally recognized as currency in the United States, providing it with constant demand.

What is Legal Tender?

An emerging form of money may have high ranks in the characteristics of money, but that doesn’t mean it will be immediately and widely recognized as money.

Legal tender is a form of money that is legally recognized as an acceptable form of payment in a country.

 
However, individuals and businesses can choose to accept forms of money that are not designated as legal tender.

The U.S. dollar is legal tender in the United States, while the peso is legal tender in Mexico.

In September 2021, El Salvador became the first country in the world to begin recognizing bitcoin as legal tender, making it a widely accepted currency in the country.

The Problems With Fiat Currencies

While fiat money such as the U.S. dollar ranks well on many of the characteristics of money, it falls short in the scarcity category. And, centrally-controlled monies can be censored, cutting out users from the financial system.

Fiat currencies do not have limited supply because governments control their country’s monetary policy, or how the money supply of their currency is managed.

The Federal Reserve is the institution that controls the monetary policy in the United States.

Centralized control of monetary policy allows for quick action in regards to the money supply, but not without consequences.

Central banks can create more units of currency instantly and without cost, like changing a number in a spreadsheet.

If the supply of money rises quickly, each unit of currency is susceptible to loss of purchasing power (more units required to buy the same amount of goods and services).

Currencies can lose purchasing power rapidly in the case of severe mismanagement of a nation’s currency.

Over time, the U.S. dollar has lost purchasing power. The longer the time period, the greater the loss of purchasing power.

Here’s a graph from the U.S. Bureau of Labor Statistics of the purchasing power of the U.S. dollar since 1913:

While there have been periods of increasing purchasing power, the long-term trend is down.

According to Visual Capitalist, $1 in 1913 could buy 30 Hershey’s chocolate bars, but only one McDonald’s coffee in 2020:

To provide more context, according to usinflationcalculator.com, $1,000 in 1913 had the same purchasing power as $28,658 in 2022:

In other words, if you held $1,000 in a bank account during that period and didn’t grow it, your $1,000 in 2022 is nearly worthless compared to what it could buy in 1913.

You needed to grow each dollar 28x to maintain purchasing power since 1913. Any returns lower than a 28x resulted in lower purchasing power.

We can compare the purchasing power loss of the U.S. dollar to the US money supply since the late 1950s:

Source: Trading Economics

The U.S. dollar has lost almost all purchasing power since the early 1900s as the Federal Reserve printed more of them.

Some economists argue that an increase in the money supply doesn’t cause inflation.

As I write this, the Federal Reserve is printing money (increasing the money supply) faster than ever before, and CPI inflation is at 7.9% year-over-year (as of Feb 2022), the highest in 40 years.

Other countries have experienced hyperinflation, which is essentially a currency failure because prices are rising so fast (higher prices = lower purchasing power).

The Zimbabwe dollar is one example of a currency that became worthless due to hyperinflation, which isn’t surprising when we look at the changes in the money supply:

Source: Trading Economics

The conclusion is that fiat currencies are not long-term stores of value. Historically, long-term holding periods of fiat currencies has led to significant loss of purchasing power.

While fiat money is efficient for short-term saving and spending (and required for payment of federal taxes) investors seeking to preserve/grow their purchasing power over time need to allocate money to other financial assets such as stocks, real estate, precious metals, or bitcoin.

Conclusion

Money serves a critical role in modern economies:

1) It serves as a medium of exchange, allowing for more trade to occur by removing the double coincidence of wants (two parties simultaneously wanting the good or service the other has to offer).

2) It serves as a unit of account or common measure of value, allowing for societies to easily understand the relative costs of things and keep track of changes in financial accounts.

3) It serves as a store of value, allowing us to preserve purchasing power (though not over long periods of time in the case of fiat currencies) and not spend all of our earnings immediately.

But not all forms of money are good.

The best forms of money rank high on a list of characteristics: durability, fungibility, divisibility, portability, verifiability, scarcity, and resistance to both confiscation and censorship.

Over the millennia, money has evolved and taken many different forms, each time advancing to a new form of money with better overall rankings in monetary characteristics.

Fiat currencies are the current global standard, as they rank high in most monetary characteristics.

Unfortunately, the history of fiat currencies shows that they fail as a store of value over time due to their unlimited supply and zero cost of creation, deteriorating the wealth of those confined to them.

Additionally, users of centrally-controlled currencies are subject to the mismanagement of the money supply and financial censorship.

Will the emergence of digital money like bitcoin, following rules of code that aren’t controlled by a central authority, be the next global standard for money?

Or will we remain on a fiat standard for centuries to come?

Time will tell.

One thing is likely: money will continue evolving over time as superior forms of money come into existence.

I truly enjoyed putting this piece together, and I hope it was insightful and succeeded in deepening your understanding of money.

Chris Butler portrait

Poor Man’s Covered Call [The Ultimate Beginner’s Guide]

One of the great benefits of options trading is the strategy customization available to traders.

In this post, you’ll learn a strategy that aims to reduce the margin requirement/maximum loss potential of the covered call options strategy.

What is a Poor Man's Covered Call?

The poor man’s covered call (PMCC) is a bullish options strategy that is an alternative to the covered call strategy requiring significantly less capital to trade.

The PMCC strategy reduces the capital/margin requirement of a traditional covered call by replacing the long stock with an in-the-money call option purchase in a long-term expiration cycle.

In a traditional covered call, an investor:

  • Buys 100 shares of stock

  • Shorts/writes an out-of-the-money (OTM) call option against the shares.

But buying 100 shares of stock requires significant investment.

In a PMCC, the 100 shares of long stock are replaced with an in-the-money long call in a longer-term expiration cycle than the short call.

Buying an in-the-money call option requires less capital than buying 100 shares of stock, reducing the margin requirement and maximum loss potential of the strategy.

The poor man’s covered call strategy allows options traders to gain similar exposure to a covered call at a fraction of the cost of a traditional covered call position.

The PMCC is technically a “diagonal debit spread,” which is a call spread with options in two different expirations instead of one expiration (which is the case for a vertical spread).

How to Set Up a Poor Man's Covered Call (Example)

To set up a poor man’s covered call, a trader will:

  • Buy a deep in-the-money call option in a long-term expiration cycle (90+ days to expiration or DTE as a guideline).

  • Short an out-of-the-money call option in a near-term expiration cycle (fewer DTE than the long call).

Let’s create a real PMCC using AAPL options.

Setting Up a PMCC in AAPL

As of this writing, the current price of AAPL is $164.

To set up a PMCC, a trader could:

1) Buy the 140 call option in the July 2022 expiration cycle (118 DTE), paying $27.65 for the option (capital outflow of $2,765).

Buy the July 140 Call (118 DTE) in AAPL (Share Price = $164)

2) Short the 175 call option in the May 2022 expiration cycle (62 DTE), receiving $3.10 for the option (capital inflow of $310).

Shorting an OTM call in AAPL
Short the May 175 Call (62 DTE) in AAPL (Share Price = $164)

Poor Man’s CC Trade Cost => $2,455 ($2,765 outflow – $310 inflow).

PMCC Trade Cost = Cost of Long Call - Credit from Short Call

If we constructed a normal covered call, we’d need to buy 100 shares of AAPL at $164 (paying $16,400 if no margin is used) instead of buying the July 2022 call.

Traditional CC Trade Cost => $16,090 ($16,400 outflow – $310 inflow).

The significantly lower capital requirement relative to a normal CC is where the poor man’s covered call gets its name.

The above images were taken on tastyworks, our preferred options trading brokerage.

Max Profit Potential

The “simple” maximum profit calculation of a poor man’s covered call is the same formula as a bull call spread’s max profit:

Max Profit: Width of Call Strikes – Trade Cost

 
Here are the trade details from our AAPL example above:

In an exaggerated scenario, if AAPL shot up to $300/share shortly after trade entry, both calls would be deep ITM and would consist mostly of intrinsic value.

The 140 call would have $160 of intrinsic value and the short 175 call would have $125 of intrinsic value. The position’s price would be $35 if both options had no extrinsic value, and the trade’s profit would be $10.45 (trade price increases to $35 from a trade cost of $24.55).

But because the strategy consists of two options with varying expiration dates, the true maximum profit potential depends on how the position is managed.

In a PMCC, the short call expires sooner than the long call. If the PMCC trader allowed the short call to expire OTM and continued holding the long call, they would be left holding a naked long call and therefore have unlimited profit potential.

Max Loss Potential

The maximum loss potential of a poor man’s covered call is the cost to enter the trade.

In the above AAPL example, the total trade cost was $24.55 (a capital outlay of $2,455).

Therefore, the maximum loss of that position would be $2,455.

If AAPL’s share price remained below the call strikes of 140 and 175 through both expiry dates, both options would expire worthless and the trader would experience the following profits and losses on each leg of the trade:

  • Profit of $310 on the short 175 call

  • Loss of $2,765 on the long 140 call

Total Loss => $2,455 (initial trade cost)

Implied Volatility vs. Poor Man's Covered Calls

What’s the ideal change in implied volatility (IV) when trading PMCCs?

The visual below describes the favorable changes in IV when trading PMCCs:

If the underlying stock price moves to or above the short call’s strike price, you want IV to fall.

Why? A decrease in IV is synonymous with a decrease in extrinsic value.

If the stock price rises to the short call strike, the long call will have mostly intrinsic value and little extrinsic value.

A decrease in IV will increase the trade’s profits driven by a drop in the short call’s value that exceeds a minuscule (or no) drop in the long call’s value, as intrinsic value is immune to changes in IV.

If the underlying stock price moves to or below the long call’s strike price, you want IV to increase.

Why? An increase in IV is synonymous with an increase in extrinsic value.

If the stock price falls to the long call strike, the long call and short call will be 100% extrinsic value.

An increase in IV will increase the trade’s price (reducing your loss) driven by an increase in the long call’s value that exceeds the increase in the short call’s value.

Time Decay vs. Poor Man's Covered Calls

Is time decay good or bad for poor man’s covered call positions?

The visual below describes how the position’s theta will change depending on where the stock price is relative to the call strikes:

If the stock price declines to the long call strike, the passage of time will drive losses in the trade (the position will have negative theta).

In this situation, both calls in the trade will consist of mostly or all extrinsic value.

The long call will be notably more valuable than the short call, meaning the long call will lose more value than the short call as time passes (negative theta).

If the stock price increases to the short call strike, the passage of time will drive profits in the trade (the position will have positive theta).

In this situation, the long call will have mostly intrinsic value and little extrinsic value, while the short call will have mostly (or all) extrinsic value.

Since intrinsic value does not decay, owning a deep ITM call with little extrinsic value and having a short ATM/OTM call with purely extrinsic value results in positive theta (profits from time passing).

How to Choose Strike Prices

Selecting strike prices can be an overwhelming process for beginner traders because there are so many options to choose from on the options chain.

Here are some rough guidelines that will help you choose call strikes for your PMCC trades:

1) Buy a call with a delta over 0.75 (a “deep” ITM call) with 90+ DTE.

2) Short a call with a delta below 0.35 (an OTM call) with <60 DTE.

Again, these are rough guidelines that can be adjusted in your specific trades. Don’t interpret the above guidelines as hard rules.

Here’s a visual representation of the target strike prices and days to expiration:

Let’s talk about why these guidelines are helpful.

Guideline #1: Buying a Deep ITM Call With 90+ DTE

Buying a deep ITM call results in owning an option with lots of intrinsic value and little extrinsic value.

Options lose extrinsic value as time passes, which is referred to as “time decay.” Intrinsic value does not decay.

As the owner of the option, we don’t want the option to lose value over time, which means buying an option with mostly intrinsic value won’t experience much time decay.

Compared to an at-the-money (ATM) or OTM call, an ITM call will have a lower theta value, indicating a lower amount of time decay with each passing day.

Longer-term options also have lower theta values than shorter-term options, further protecting us from time decay.

Lastly, by purchasing a call with a delta of 0.75 or higher, the call’s price will change similarly to owning 100 shares, helping us replicate a covered call without an actual long stock position.

Guideline #2: Short an OTM Call With <60 DTE

Shorting an OTM call results in betting against an option with 100% extrinsic value.

Short option traders profit when the option value falls, benefiting from time decay.

An OTM option’s price will fall to zero if it is still OTM at its expiration date.

Shorter-term options decay faster than longer-term options, which is why a shorter-term expiration cycle is used for the short option in a PMCC position.

A call with a delta of <0.35 will have a strike price decently higher than the share price, allowing for more upside profit potential compared to shorting a call that’s closer to the stock price.

Be Careful of the Entry Cost

It is essential that the entry cost is notably less than the width of the strikes.

Otherwise, the position’s max profit potential will be minuscule (or negative).

tastytrade’s guideline is that the trade cost is less than 75% of the width of the strikes. I agree with this guideline.

In our earlier AAPL example, the width of the strikes was $35 and the trade cost was $24.55 (70% the width of the strikes).

The guideline is important because, should the stock price surge, the position’s price will trend towards the width of the strikes.

Because we are trading two options in different expiration cycles, it’s possible to pay more than the width of the strikes:

In the image above, the strike width is $15 and the trade entry cost is $15.22.
 
As a theoretical example, if the stock price shot up to $1,000, the position’s price would end up at $15.00 because the options would be so deep ITM that they’d have almost no extrinsic value.
 
If we paid $1,522 for a position that ended up being worth $1,500 when the stock price surged, we’d lose $22 on a trade we entered to profit from stock price rallies.
 
Listen to tastytrade’s guideline and avoid this situation by only entering positions that cost less than 75% the width of the strikes.

How to Manage a Poor Man's Covered Call

If the short call remains OTM as time passes/expiration nears, the trader can buy back the call for a profit and short a new call in the next expiration cycle to collect more premium and continue the strategy.

Eventually, the trader will need to close/roll the ITM call once it gets close to expiration, but the longer-term call won’t need to be managed as frequently as the shorter-term short calls.

If the stock price surges and both calls are ITM, the trader needs to decide if they want to continue the strategy.

In the case of the stock price being above the short call’s strike, the passage of time will continue to drive profits in the trade.

Once the short call’s extrinsic value drops close to zero, the position will be at its maximum profit potential with the current setup. The trader can then close the entire trade.

How to Close a Poor Man's Covered Call

To close a PMCC position, buy back (cover) the short call and sell the long call. Sell what you own and buy what you’re short.

In our previous example of entering a PMCC in AAPL by purchasing the JUL 140 call and shorting the MAY 175 call, a trader can close the position by:

  • Selling the long JUL 140 call

  • Buying/covering the short MAY 175 call

You can complete these transactions with one order.

If you decide to “unwind” the position with separate orders, start by buying back the short call, then sell the long call.

Early Assignment Risk When Trading PMCCs

Is there early assignment risk when trading PMCCs?

Yes, because there is a short option component in the position.

If the stock price moves above the short call’s strike price, the trader may get assigned short stock if a counterparty trader exercises the call option.

But don’t worry! Assignment risk is low unless the short call is ITM with close to zero extrinsic value, which happens when:

  • The short call option has little time to expiration, and/or:

  • The short call option is deep ITM.

The further ITM a call option is, the less extrinsic value it will have.

The less time to expiration an option has, the less extrinsic value it will have.

So if you’re trading a PMCC and the short call is ITM with multiple dollars of extrinsic value, you do not need to worry about early assignment risk.

The only other thing to watch out for is if the stock has an upcoming dividend payment. In that situation, any ITM short calls with extrinsic value less than the amount of the dividend are at risk of early assignment.

Tax Implications When Trading PMCCs

There are tax considerations that options traders need to be mindful of when trading poor man’s covered calls.

In a traditional covered call, the trader will own 100 shares of stock, which have no expiration date and can be held forever. Once the shares are held for more than one year, any gains on the shares will be taxed at the long-term capital gains rate.

In a poor man’s covered call, the trader uses an ITM call option instead of stock, forcing the trader to sell/roll the long call once it reaches expiration.

If the trader bought a call with 120 DTE, they would need to sell the call before expiration and buy a new ITM call to continue the trading strategy.

Consequently, any gains on the initial call would be taxed at the trader’s short-term capital gains rate because they held the option for less than one year.

Conclusion

The poor man’s covered call is becoming a popular options strategy for those with limited capital.

The strategy significantly reduces the capital requirement (and max loss) of a traditional covered call by replacing long stock with a deep ITM call option. The lower buying power requirement also boosts the potential return on capital.

However, it is much easier to lose 100% of your investment with a PMCC compared to a traditional CC, making it a more aggressively bullish strategy.

Compared to a traditional covered call, a PMCC will require more active management as the strategy is composed purely of options contracts.

There are also greater tax implications when trading PMCCs because each trade component will typically be held for less than one year, pushing all gains into short-term capital gains taxation.

But for those interested in gaining exposure to covered calls with less money, the poor man’s covered call is an option (pun intended).

*Before trading options, traders should read the Characteristics and Risks of Standardized Options, or the Options Disclosure Document (ODD).*

Next Lesson

Chris Butler portrait

VIX Contango: The Ultimate Beginner’s Guide

VIX Contango: The Ultimate Beginner's Guide

Stock market volatility products are confusing for beginner market participants because of their complexity.

Fear not!

In this particular guide, you will develop an understanding of:

  • Contango and backwardation in the Cboe volatility index (VIX) market

  • The major implications it has for the performance of popular volatility products such as VXX and UVXY.

  • VIX trading strategies for contango and backwardation market conditions

Prepare to take one step closer to becoming a master of the VIX/volatility landscape!

What is Contango?

Contango” refers to a situation where futures contracts trade at a premium to the “spot” price (the current price) of a commodity/index.

For example, if the Cboe VIX index is at 15 and the VIX futures contract settling in 30 days is 17, we have contango in the VIX futures market.

Here’s a simple example visualization of contango:

When VIX futures are trading above the VIX index, contango is present. The result is an upward-sloping curve.

Contango is typically present in the VIX market, making it more useful to understand than backwardation (the opposite of contango). We will briefly cover backwardation in a later section.

Why is Contango Important to Understand?

Contango in the VIX market drives the performance of volatility products and trading strategies, so understanding it will help you make more informed trades.

In the VIX market, the VIX index is the calculation of expected S&P 500 volatility based on 30-day S&P 500 index (SPX) option prices. But we can’t directly trade the VIX index because there are no VIX shares. To trade VIX index predictions, traders turn to VIX options and futures.

But before trading futures, it’s essential to understand how futures prices perform over time relative to the spot price.

Futures Prices Converge to the Spot Price

A critical concept to understand in futures markets is that futures prices converge towards the spot price over time:

Futures prices converge to the spot price over time. On the settlement date of a futures contract, its price will equal the spot price of the commodity it tracks.

On a futures contract’s expiration date, the contract’s price will equal the spot price.

A futures contract with no future equals the spot price.

For example, if the VIX index is at 15 and a 30-day VIX futures contract is at 17, the contract’s price will fall from 17 towards 15 with each passing day if the VIX index remains at 15:

The above image illustrates how a futures price converges to the spot price over time if the spot price remains constant.

In reality, the VIX index will fluctuate as market volatility changes, but volatility index futures will get “pulled” towards the index as their settlement dates approach.

Here’s a visual using real historical data to prove this:

VIX futures prices converging to the VIX index as their settlement dates approach.

As we can see, each contract’s price equals the VIX index value at expiry.

What can we do with this information?

The VIX Futures Curve

Volatility traders pay close attention to the “VIX futures curve” or “VIX term structure” because it can inform them of how volatility products will perform over time if volatility remains unchanged. It also tells us how much we need the VIX index to change for our volatility trades to work out.

The “VIX futures curve” is simply a chart of the prices of VIX futures contracts with varying expiration dates, from shorter-term to longer-term.

VIX Central is a free resource for visualizing the current VIX futures curve, as well as viewing historical curves.

VIX Contango Example

When the VIX futures are in contango, we get an upward-sloping curve, indicating that longer-term contracts are more expensive than shorter-term contracts:

VIX Central futures curve from January 2017 displaying contango.

VIX Backwardation Example

When the VIX futures are in backwardation, we get a downward-sloping curve, indicating that longer-term contracts are cheaper than near-term contracts.

The current futures curve is in backwardation as I write this in March 2022:

VIX futures in backwardation. Longer-term contracts are more expensive than short-term contracts.

In the above curve, the March and April contracts are trading at the level of the VIX, but the longer-dated contracts are at lower and lower values the further out the settlement date.

During normal/low volatility market periods, the VIX futures are usually in contango. We’ll explore the intuitive understanding of why that is in a later section.

VIX Futures Contango vs. ETP Performance

The performance of VIX futures determines the performance of popular volatility exchange-traded products (ETPs).

For example, the daily performance of VXX is equal to the daily percentage changes of front-month and back-month VIX futures. Be sure to read our guide on VXX for an in-depth understanding of this product’s mechanics.

When VIX futures contango is present, short-term VIX futures contracts will bleed value with each passing day if the VIX index does not increase.

The result? Long volatility products like VXX and UVXY will experience drawdowns since their performance stems directly from daily changes in VIX futures. Short volatility products like SVXY and SVIX benefit from persistent contango.

Why Are VIX Futures Usually in Contango?

During normal market conditions, the Cboe VIX Index is typically below 20. When the VIX is below 20, it’s common for contango to be present in the VIX futures market.

An easy way to understand why is to think of a VIX futures contract as insurance. When stock market volatility increases, the VIX index and futures rise, making them popular hedging instruments for risk managers.

During a financial crisis, such as in 2008 or 2020, the VIX index and futures spiked as the stock market collapsed violently.

Here’s how the volatility index futures reacted to the VIX spike in 2008:

In 2008, the VIX index spiked over 80 as the market collapsed. VIX futures also increased as they were pulled higher by the VIX.

If the market is in a low volatility period, risk management desks might buy VIX futures to hedge their portfolios against an increase in market volatility. As seen above, long positions in volatility index futures will gain value during market crises. The profits from these long volatility positions will offset losses in long equity positions.

Since futures contracts have expiry dates, volatility traders must decide between hedging short-term and long-term.

Generally speaking, there’s a higher probability of negative events occurring over a longer period of time (such as five years) as opposed to a shorter period of time (such as one month).

The probability of the market falling 10% is higher over a 1-year period than a 1-week period.

As a result, buying long-term VIX futures provides traders with a long duration of protection, justifying a higher price compared to buying a short-term future that provides only a small window of protection.

And so during normal market conditions, longer-term volatility futures trade at higher prices than shorter-term volatility futures, resulting in contango in the VIX futures market.

How can traders take advantage of contango in the VIX?

VIX Contango Trading Strategies

When contango is present, VIX futures and long volatility products like VXX and UVXY all predictably lose value if the VIX does not increase.

The VIX index is directly tied to the realized S&P 500 volatility.

If S&P 500 volatility increases, traders will bid up SPX option prices (which are used to calculated the VIX) as the expected movements of the S&P 500 index increase.

If S&P 500 volatility falls, the expected movements of the S&P 500 index contract. SPX option prices will fall (VIX falls).

The VIX Index follows the actual volatility of the S&P 500.
What does this have to do with contango?
 
If VIX contango is present and traders believe S&P 500 volatility will remain unchanged or decrease, profits can be made from short volatility trading strategies, including:
  • Shorting VIX futures

  • Shorting VXX/UVXY shares

  • Buying puts on VIX/VXX/UVXY

  • Shorting calls on VIX/VXX/UVXY

These strategies can profit from persistently low market volatility, as the VIX futures will remain in contango and steadily lose value as they converge towards the lower VIX spot price (visualized earlier in this post).

However, traders should be cautious with short volatility trading strategies because when market volatility increases, it can do so violently.

For example, in the financial market crisis of 2020, the VIX index went from below 14 to over 80 within two months as the S&P 500 fell over 30%. Traders who were short volatility got destroyed during that time period, while traders who were long volatility experienced massive profits.

If you want to profit from contango in the VIX futures, trading strategies such as buying put options on VXX or UVXY provide traders with limited loss potential in the event of a spike in market volatility.

What Happens When VIX is in Backwardation?

The majority of this guide covers contango because it is present in the VIX market a high percentage of the time.

VIX backwardation occurs when the VIX index is above VIX futures contracts, and longer-term futures are at a discount to shorter-term futures.

Backwardation in VIX futures occurs when market volatility is elevated.

Since VIX futures always converge towards the spot VIX over time, VIX futures will appreciate over time if the spot VIX remains above these futures contracts.

For example, if it is February 1st and the VIX is at 50, and the March VIX future is at 40, the March VIX future will appreciate 10 points by its expiration date if the VIX index remains at 50.

That means long volatility ETPs like VXX and UVXY will also appreciate over that period since they track the daily percentage changes of short-term VIX futures.

But market volatility is always changing, and periods of extreme market volatility typically do not last long. Consequently, the VIX market can go from backwardation to contango quickly if the market recovers and volatility falls.

VIX Backwardation Trading Strategies

When backwardation is present, VIX futures and long volatility products like VXX and UVXY all gain value over time if the VIX does not fall drastically.

If VIX backwardation is present and traders believe S&P 500 volatility will remain unchanged or increase further, profits can be made from long volatility trading strategies, including:


  • Buying VIX futures
  • Buying VXX/UVXY shares
  • Buying calls on VIX/VXX/UVXY
  • Shorting puts on VIX/VXX/UVXY

These strategies can profit from persistently high market volatility, as the VIX futures will remain in backwardation and steadily appreciate as they converge towards the higher VIX spot price.

However, traders should be cautious with long volatility trading strategies when market volatility is already elevated, especially if it is extremely high (VIX over 50).

Extreme market volatility typically does not last long, which is precisely why long-dated VIX futures will trade at steep discounts to spot VIX during periods of significant market volatility.

Conclusion

Understanding contango and backwardation is key when trading VIX options, futures, and popular volatility products like VXX, UVXY, or SVXY.

The most critical concept to understand is that volatility products are tied to VIX futures, which converge to the VIX index over time.

During normal market conditions, contango is typically present in the VIX futures curve, leading to steady bleed in the values of volatility index futures as they drift towards the lower VIX index.

The result is losses in long volatility positions (long futures, long VIX calls/short VIX puts, long VXX/UVXY).

For traders to profit from long volatility positions when contango is present, market volatility needs to increase quickly, pulling the VIX index and futures higher.

Otherwise, traders can take advantage of the “contango bleed” and profit from short volatility positions as long as market volatility does not surge. Of course, shorting volatility is no easy trade.

At a minimum, I hope this post helped you grasp the complexities of the volatility market, helping you avoid common pitfalls and disastrous trading results that stem from a lack of awareness related to VIX trading.

Next Lesson

Chris Butler portrait

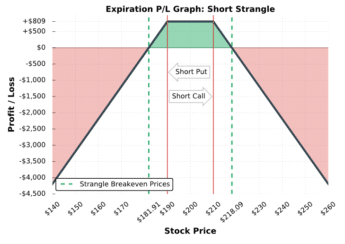
Short Strangle Adjustment: Rolling Up the Short Put

Sometimes, you’ll need to make an adjustment to your option positions when the stock price moves against you.

In this post, we’re going to discuss the short strangle adjustment strategy of “rolling up” the short put options.

What is "Rolling an Option?"

Rolling an option is the process of closing an existing option and opening a new option at a different strike price or in a different expiration cycle. This generally happens when in-the-money options are expiring

Today, we’ll focus on “rolling up” the short put option in a short strangle position, which refers to buying back your current put option and “rolling it up” by selling a new put at a higher strike price.

When Do You Roll Up the Put?

Let’s talk about when a trader would most likely roll up the short put.

Consider the following visual:

rolling put option

As we can see, the stock price is rising quickly and approaching the short call’s strike price. Since short strangles have negative gamma, the position’s delta grows negative as the stock price trends towards the short call.

The result?

The trader starts to lose more and more money as the stock price continues to increase.

The most common short strangle adjustment to make in this scenario is to roll up the short put option:

To roll up the short put option, a trader simply has to buy back their current short put option and sell a new put option at a higher strike price (in the same expiration cycle).

What Does Rolling Up the Puts Accomplish?

By rolling up the short put option in a short strangle position, a trader accomplishes two things:

1. Collect more option premium since the new put you sell is more expensive than the put you buy back.

2. Your position’s delta becomes more neutral, which means you’ll lose less money if the stock price continues to increase.

Let’s cover each of these points in more depth.

#1: Collect More Option Premium

Consider a trader who is short the 220 put option in their short strangle position, but rolls the 220 put to the 235 put:

Put Strike Price

Option Price

Delta

Trade

235

$1.60

-0.30

Sell (Open)

230

$0.85

-0.16


225

$0.50

-0.09


220

$0.31

-0.06

Buy (Close)

Since the trader buys back the 220 put for $0.31 and sells the 235 put for $1.60, they collect additional option premium from rolling up the put:

Premium Collected:

$1.60 Collected – $0.31 Paid Out = +$1.29

In dollar terms, the additional $1.29 in premium means the maximum profit on the trade increases by $129 per short strangle, and the upper breakeven point is also extended $1.29 higher.

As a result, the stock price can increase even further than it could before and the trade can still be profitable.

#2: Neutralize Your Position Delta

By rolling up the put option, the position also becomes more neutral.

Let’s say that at the time of the roll, the short strangle’s position delta is -44 (the trader is expected to lose $44 from a $1 increase in the stock price, and make $44 from a $1 decrease in the stock price).

Here’s how the position delta would change after the rolling adjustment from the previous example:

Put Strike Price

Option Price

Delta

Trade

235

$1.60

-0.30

Sell (Open)

220

$0.31

-0.06

Buy (Close)

Old Put Position Delta: +6 (-0.06 Put Delta x $100 Option Multiplier x -1 Contract)

New Put Position Delta: +30 (-0.30 Put Delta x $100 Option Multiplier x -1 Contract)

Change in Position Delta: +24

New Short Strangle Position Delta: -44 + 24 = -20

After rolling up the short put, the position delta becomes more neutral.

With a new position delta of -20, the trader is only expected to lose $20 if the stock price increases by $1, as opposed to a $44 loss before the roll.

Of course, this also means the trader is only expected to gain $20 from a $1 decrease in the share price, as opposed to a $44 gain before the short strangle adjustment.

With that said, it’s clear that it’s not all peachy when it comes to rolling up the short put. Let’s talk about the downsides of rolling up.

What's the Risk of Rolling Up the Put?

While rolling up a short put increases the option premium received (higher maximum profit potential) and neutralizes your position delta, there are some downsides:

1. You decrease the range of maximum profitability, as your new put’s strike price is much closer to the short call’s strike price.

2. The position delta gets neutralized, which means a reversal in the stock price results in less profits than if the rolling adjustment wasn’t made. Even worse, the position delta will start to grow positive if the stock price continues to fall after rolling up the put (resulting in losses if the stock keeps falling).

As with any trade adjustment, there are benefits and downsides. However, if you’re looking for a short strangle adjustment to help reduce the directional risk after a rally in the stock price, then rolling up the short put is one option available to you (pun intended).

Concept Checks

Here are the essential points to remember the short strangle adjustment of rolling up the short puts:


  1. When selling strangles, if the share price appreciates towards your short call, you can adjust the position by “rolling up” the short put (buy back the old short put, sell a new put at a higher strike price).
  2. By rolling up the old put, you increase the amount of option premium collected and neutralize your position delta (resulting in a higher upper breakeven point and less notable losses if the stock price continues to rise).
  3. The downside of rolling is that you decrease the range of maximum profitability since your new put strike is closer to the short call’s strike price. Additionally, you’ll make less money (or potentially lose money) from reversals in the stock price after rolling.
 

Next Lesson

Additional Resources

Chris Butler portrait

Covered Put Writing Explained (Best Guide w/ Examples)

The covered put writing options strategy consists of selling a put option against at least 100 shares of short stock. 

By itself, selling a put option is a highly risky strategy with significant loss potential. However, when combined with a short stock position of 100 shares, selling a put option adds no additional risk, and creates a way to profit when the share price remains flat or even increases slightly.

Additionally, the credit received from the put option provides protection against increases in the stock price. The true “cost” of selling a put against short stock is that the potential profits of the short shares will be capped below the strike price of the put that is sold.

Covered Put Strategy – General Characteristics

Let’s go over the strategy’s general characteristics:

Max Profit Potential: (Share Sale Price + Credit Received for Put – Short Put Strike) x 100

Max Loss Potential: Unlimited

Expiration Breakeven: Share Sale Price + Credit Received for Put

Approximate Probability of Profit: Greater Than 50% (assuming the stock and put are sold at the same time)

To gain a better understanding of these concepts, let’s walk through a hypothetical trade example.

Profit/Loss Potential at Expiration

In the following example, we’ll construct a covered put position from the following options chain:

In this example, let’s assume that we sell the 85 put for $3.00, and that the stock is trading for $90 when we short the shares:

Share Sale Price: $90

Put Strike Sold: $85

Premium Collected for the 85 Put: $3.00

Here are this particular position’s characteristics:

Max Profit Potential: ($90 share sale price + $3 premium received – $85 short put strike) x 100 = $800

Max Loss Potential: Unlimited

Expiration Breakeven Price: $90 share sale price + $3 credit received = $93

Probability of Profit: Greater than 50% because the stock price can increase $3 and the position can break even (no loss).

The chart below visualizes this position’s profit and loss potential based on various stock prices at expiration:

covered put vs short stock

As you can see, selling 100 shares of stock at $90 and selling the 85 put for $3 reduces the risk of the position compared to just shorting stock. Since premium is collected for selling the put, the sale price of the shares is effectively increased by the sale price of the put. Therefore, the breakeven price of a covered put position is the effective sale price of the shares. The benefit of a higher breakeven price comes at the cost of lower profit potential when the shares decrease.

In this graph, we’ve also added the profits and losses for a short stock position as a comparison. Compared to the short stock position, the covered put has less loss potential and more profit potential at most stock prices at expiration. However, if the stock price falls significantly below the short put strike, then the short stock position without a short put against it will produce more profits.

Because of this, a covered put writer is usually not extremely bearish on the stock price.

Nice job! You know the potential outcomes of a covered put position at expiration, but how does the position perform over time before expiration? To demonstrate this to you, we’re going to look at a few trade examples using real option data.

Covered Put Trade Examples

In the following examples, we’ll compare changes in the stock price to a covered put position on that stock. Note that we won’t discuss the specific stock the trade was on, as the same concepts apply to other stocks in the market. Lastly, each example uses a trade size of one covered put (-100 shares of stock against one short put). 

Trade Example #1: Maximum Profit Covered Put Position

First, let’s examine a situation where covered put writing is less lucrative than just shorting shares of stock.

Here are the trade details:

Initial Share Purchase Price: $50.47

Strike Price and Expiration: Short 47 put expiring in 44 days

47 Put Sale Price: $2.03

Breakeven Stock Price (Effective Share Sale Price): $50.47 share sale price + $2.03 credit received from put = $52.50

Maximum Profit Potential: ($52.50 effective share sale price – $47 short put strike) x 100 = $550

Maximum Loss Potential: Unlimited

Let’s see what happens!

covered put chart

As illustrated here, a covered put position has limited profit potential. In this example, the stock price collapses from $52.50 to $37.50, resulting in over $1,250 in profits for the short stock position. However, the covered put has a short 47 put, which caps the position’s profits at any stock price below $47. With an effective share sale price of $52.50 and a short put strike of $47, the maximum profit of this covered put position is $550.

Another important note about this particular trade is that the position does not need to be held to expiration to realize profits. In this example, maximum profit occurs with around 18 days to expiration. The trader could lock in profits at this point by simultaneously buying back the short shares and the short put, thereby closing the covered put position.

At expiration, the short put is in-the-money, which means the covered put trader would be assigned +100 shares of stock at the put’s strike price of $47. Since the trader is already short 100 shares of stock, the assignment effectively forces the trader out of their stock position. To avoid assignment, the trader could buy back the 47 put before expiration. However, keep in mind that it’s always possible to be assigned early on an in-the-money short put, especially when the put has little extrinsic value remaining.

Next, we’ll look at an example of when covered put writing works out much better than just shorting stock.

Trade Example #2: Covered Put Outperforms Short Stock

In the next example, we’ll look at a situation where the stock price increases slightly over a 46-day period after a covered put position is entered. We’ll compare the position’s performance to a short stock position.

Here are the trade details:

Initial Share Purchase Price: $114.88

Strike Price and Expiration: Short 112 put expiring in 46 days

112 Put Sale Price: $5.02

Breakeven Stock Price (Effective Share Sale Price): $114.88 share sale price + $5.02 credit received from put = $119.90

Maximum Profit Potential: ($119.90 effective share sale price – $112 short put strike) x 100 = $790

Maximum Loss Potential: Unlimited

Let’s see how the covered put performs!


covered put performance

In this example, you’ll notice that the covered put position performs better than the short stock position as long as the stock price doesn’t fall significantly. Most importantly, this covered put position doesn’t lose money even though the stock price increases from the short stock entry price because the profits from the short put offset the losses on the short shares.

As mentioned in the previous example, a covered put writer can buy back their position to lock in profits or losses before expiration. In this example, the trader had many opportunities to close the position for profits over $500, which represents nearly 66% of the maximum profit potential.

At expiration, the covered put writer doesn’t have to worry about assignment because the put is out-of-the-money. Additionally, the trader could sell another put in the following month to collect more premium and increase the breakeven price of their short stock position even further.

In the final example, we’ll look at a covered put position that realizes a significant loss.

Trade Example #3: A Covered Put Gone Wrong!

In the final example, we’ll look at a scenario where a covered put position is unprofitable but better off than just shorting the stock.

Here are the trade details:

Initial Share Purchase Price: $162.60

Strike Price and Expiration: Short 140 put expiring in 42 days

140 Put Sale Price: $6.72

Breakeven Stock Price (Effective Share Sale Price): $162.60 share sale price + $6.72 credit received from put = $169.32

Maximum Profit Potential: ($169.32 effective share sale price – $140 short put strike) x 100 = $2,932

Maximum Loss Potential: Unlimited

Let’s see what happens!

covered put loss

As we can see here, the covered put position did not perform well because the stock price increased significantly above the breakeven price of the position. However, since the 140 put expired worthless, the covered put position was $672 better off than the short stock position by itself. Because of this, selling puts against short stock positions reduces the losses when the stock price rises.

At expiration, the covered put trader would not have to worry about assignment since the 140 put was out-of-the-money.

Congratulations! Hopefully, you are now much more comfortable with how covered put writing works! In the next section, we’ll discuss how to go about selecting which put to sell.

How to Select a Put Strike to Sell

At this point, you know how covered put writing works, as well as when you might use the strategy. However, with so many different put strikes available, how do you choose which one to sell? We’ve put together a simple guide that may help the strike price selection process easier.

Determine Your Outlook

Before selecting a put strike to sell, it’s crucial to determine an outlook for the shares of stock that you’re short.

Here is a quick guide that demonstrates how to select a put strike based on various outlooks.

Put Selling Guidelines Based on Various Stock Price Outlooks

Share price will increase significantly

With such a bullish outlook, shorting shares of stock or trading covered puts is probably not the right strategy in the first place. However, if you must trade a covered put, selling an at-the-money or even an in-the-money put option would provide the most upside protection.

Share price may remain relatively flat, or even decline slightly

With a neutral to bearish outlook, selling puts with strike prices closer to the stock price (-0.40 to -0.50 delta puts) may be logical. Selling at-the-money puts provides the greatest profit potential from the decay of the put’s extrinsic value, as well as the most protection from share price increases.

Share price will fall significantly

With such a bearish outlook, selling puts against a short stock position may not be logical since the profit potential will be capped. However, if you insist on trading a covered put, then selling a put with a lower probability of expiring in-the-money (-0.15 to -0.25 delta) may be logical.

The sections above serve as a guideline for selecting a put to sell. When trading covered puts, there isn’t a “one-size-fits-all” approach. The put that is sold depends on the investor’s outlook for the stock price in the future.

Chris Butler portrait