Last updated on March 15th, 2022 , 09:42 am
The S&P 500 is the most-watched U.S. equity index among traders and investors around the world, as it is perhaps the best representation of the U.S. stock market. Not surprisingly, the options on the S&P 500 Index (SPX) are extremely active, as market participants can use SPX options to trade predictions related to the overall market, or hedge a portfolio of stocks efficiently.
Since the prices of options can serve as an indication of marketplace fear or complacency, traders and investors around the world like to pay attention to the levels of SPX option prices, as well as any changes in those option prices as the value of the S&P 500 and economic conditions change.
To quantify SPX option prices, we can refer to the CBOE’s many volatility index products.
What Are VXST, VIX, VXV, and VXMT?
There are four primary CBOE volatility index products related to the S&P 500 Index options. Each of the following indices quantify the prices (implied volatility) of SPX options with varying lengths of time until expiration:
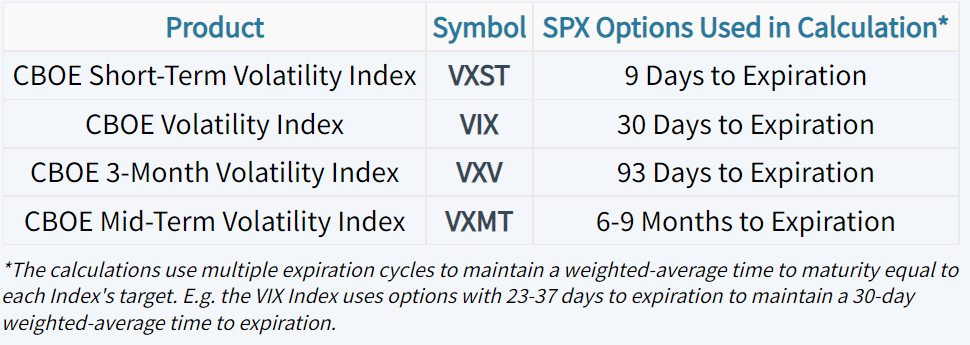
Each of these volatility indices can be used to gauge demand for S&P 500 options over different time frames.
Short-Term vs. Long Term Implied Volatility: Calm Market Periods
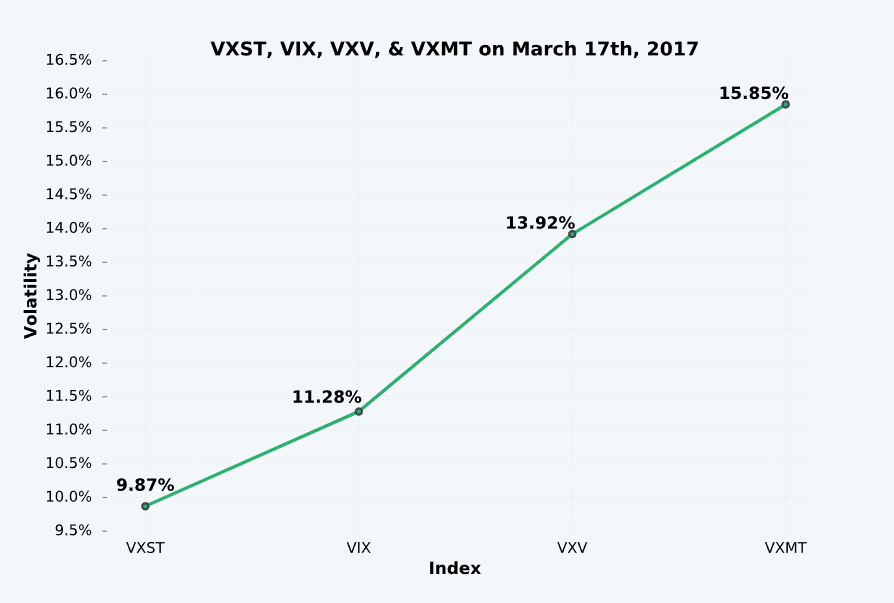
So, what is the “normal” relationship between these volatility indices? When markets are calm, near-term implied volatility typically trades at a discount to longer-term implied volatility (VXST < VIX < VXV < VXMT).
The following chart demonstrates the typical near-term and long-term implied volatility relationship when markets are calm:
As we can see, the CBOE Short-Term Volatility Index (VXST) is at a significant discount to the CBOE Mid-Term Volatility Index (VXMT). In other words, demand for short-term options is much less significant than the demand for long-term options.
What explains this relationship? When implied volatility is low, it’s usually because the market’s realized movements on a day-to-day basis are small. With minuscule market movements, there’s less demand for protection in the form of SPX options over all time frames because smaller daily market movements translate to more certainty and less fear.
However, there’s less certainty over longer periods of time, which explains why longer-term option prices tend to trade with higher levels of implied volatility.
Short-Term vs. Long Term Implied Volatility: Fearful Market Periods
During extremely fearful market periods this relationship inverts, as demand for short-term protection increases much faster than the demand for long-term protection. We can visualize this by looking at VXST, VIX, VXV, and VXMT into the market correction of August 2015:
As we can see, VXST, VIX, VXV, and VXMT all shifted higher, but near-term implied volatility increased the most. Here’s a snapshot of these volatility indices on August 24th, 2015:
In this particular snapshot, near-term SPX option prices are pumped up to an implied volatility that is significantly higher than the longer-term SPX option prices.
During highly volatile market periods, there’s more fear and less certainty, which translates to more demand for protection. When fear becomes the dominant force in the marketplace, short-term options tend to trade at higher implied volatilities than longer-term options because there’s less certainty in the near-term, but also an expectation that the fear will eventually subside (as indicated by VXV and VXMT trading at a discount to VXST and VIX).
During a period of high market volatility, the expectation of less volatility in the future is similar to that of a human’s emotions. When somebody gets angry, it’s typically only a short burst. In time, the person cools down and returns to a “normal” state. It’s the same thing with market volatility.
By using VXST, VIX, VXV, and VXMT, we can keep an eye on the “temperature” of the market, and gain more context around the market’s demand for short-term and long-term options.
Summary of Main Concepts
To quickly summarize what this post has covered, here are the key points to remember:
- Option prices can help us take the “temperature” of the market. To quantify the prices of options on the S&P 500, we can keep an eye on VXST, VIX, VXV, and VXMT.
- VXST is the CBOE Short-Term Volatility Index, which tracks the implied volatility of S&P 500 Index options with 9 days to expiration.
- The VIX is the CBOE Volatility Index, which tracks the implied volatility of S&P 500 Index options with 30 days to expiration.
- VXV is the CBOE 3-Month Volatility Index, which tracks the implied volatility of S&P 500 Index options with 93 days to expiration.
- VXMT is the CBOE Mid-Term Volatility Index, which tracks the implied volatility of S&P 500 Index options with 6-9 Months During calm market periods (small daily market movements), short-term options (quantified by VXST) typically trade at a lower implied volatility than longer-term options (quantified by VXMT). This relationship indicates more certainty in the near-term and less certainty over the long-term to expiration.
- During volatile market periods (large daily market movements), short-term options (quantified by VXST) typically trade at a higher implied volatility than longer-term options (quantified by VXMT). This relationship indicates more fear and less certainty in the near-term, and an expectation that market volatility (and fear) will subside to a more “normal” level over the long-term.

