Last updated on February 28th, 2022 , 02:20 pm
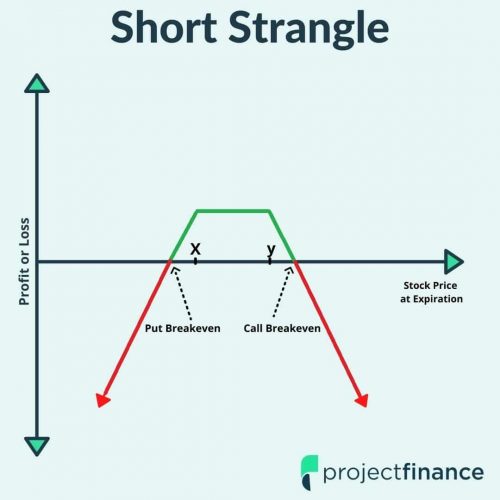
In this article, we’ll examine the historical performance of selling strangles on the S&P 500, and the impact of closing trades using profit targets and stop-losses.
What is a Short Strangle?
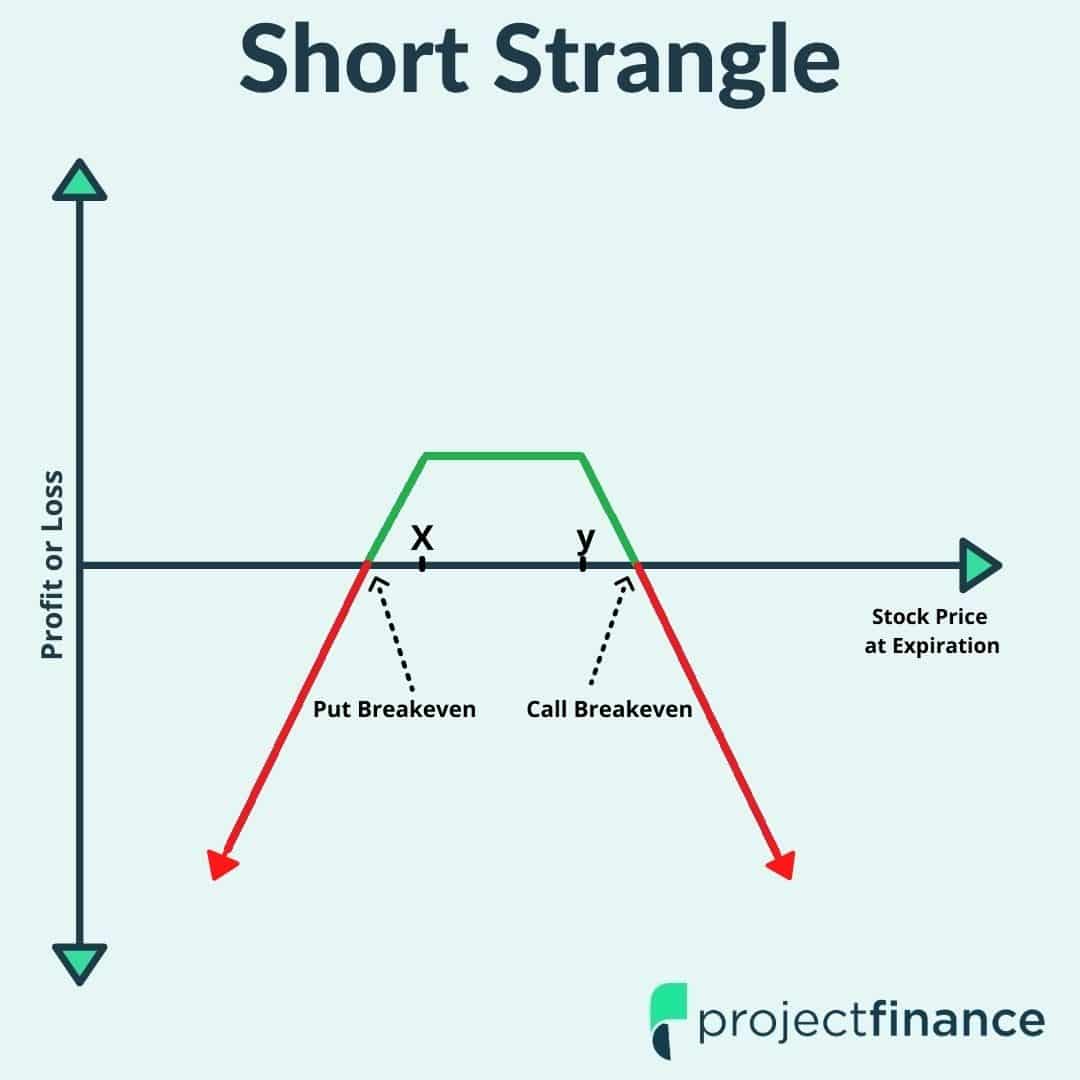
A short strangle is an options strategy constructed by simultaneously selling a call option and selling a put option at different strike prices (typically out-of-the-money) but in the same expiration. Selling a strangle is a directionally-neutral strategy that profits from the passage of time and/or a decrease in implied volatility. A trader who sells a strangle is anticipating the stock price to stay in-between the strangle’s strike prices in the near future, as the options that were sold will experience extrinsic value decay as expiration approaches.
For instance, if a stock is trading at $100 and the trader wants to profit from a scenario in which the stock price trades between $90 and $110 over the following 30 days, the trader could sell the 90 put and 110 call in the options closest to 30 days to expiration.
The Risk of Selling Strangles
The most a trader can make when selling a strangle is the total amount of option premium collected for selling the call and put, while the loss potential is virtually unlimited.
Short Strangles on the S&P 500
Instead of just looking at the results of holding the short strangles to expiration, we’ll examine the usage of stop-losses as well to see if closing losing trades has improved the strategy’s performance over time.
Study Methodology
Product: S&P 500 ETF (SPY)
Expiration: Standard monthly cycle closest to 60 days to expiration (60 DTE).
Trade Setup: Sell the 16-delta call and 16-delta put.
Management: None (hold to expiration), -50% loss, -100% loss, -200% loss.
Next Entry Date: First trading day after previous trades were closed.
Stop-Loss Example
To make sure you understand the stop-loss calculations, here are some examples:
Initial Strangle Sale Price: $2.00
-50% Loss: Strangle price increases by 50% to $3.00.
-100% Loss: Strangle price increases by 100% to $4.00.
-200% Loss: Strangle price increases by 200% to $6.00.
The stop-loss is just the percentage increase over the initial sale price that is used as a trigger to close the trade.
SPY Short Strangles: Taking Losses
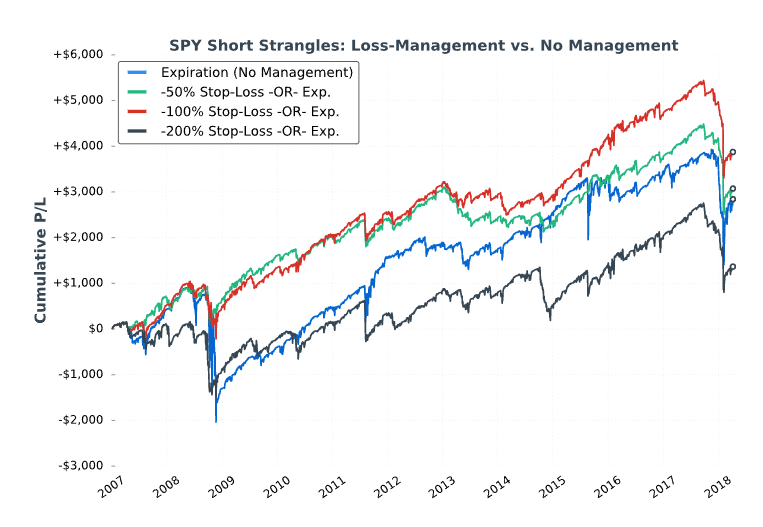
Here are the results of the first study:
*Please Note: Hypothetical computer simulated performance results are believed to be accurately presented. However, they are not guaranteed as to the accuracy or completeness and are subject to change without any notice. Hypothetical or simulated performance results have certain inherent limitations. Unlike an actual performance record, simulated results do not represent actual trading. Also, since the trades have not actually been executed, the results may have been under or over compensated for the impact, if any, or certain market factors such as liquidity, slippage and commissions. Simulated trading programs, in general, are also subject to the fact that they are designed with the benefit of hindsight. No representation is being made that any portfolio will, or is likely to achieve profits or losses similar to those shown. All investments and trades carry risk.
Compared to holding to expiration, taking 50-100% losses on the short strangles helped avoid some massive losses, but all strategies still suffered substantial drawdowns in certain periods (especially the February 2018 crash).
The largest stop-loss of 200% was the worst-performing approach, which I suspect is due to the fact that the market has been on a bull run over the test period, which means any sharp declines that caused a 200% loss on the short strangles recovered very quickly. In other words, a lot of trades were stopped out at a 200% loss that later ended with profits or less-severe losses.
Here are some performance metrics related to each management approach:
As expected, the -50% stop-loss level had a lower success rate compared to the other approaches. If you’re wondering how the -100% stop-loss level had a higher success rate than the -200% stop-loss level, it’s because there were more overall trades in the -100% stop-loss approach, and the overall success rate happened to be slightly higher.
On a more important note, we can see that the worst losses experienced were far greater than the chosen stop-loss levels, which brings up a very important point to keep in mind when using stop-losses on undefined-risk strategies:
If the market moves significantly in a short period of time (usually that means a market crash), it can be very difficult to close trades at favorable prices because the bid-ask spreads of the options will widen significantly. Additionally, the study uses end-of-day data, which is one limitation of options backtests.
Let’s take a look at how many profitable trades would be needed to recoup the worst losses (based on the median closing P/L of the trades in each approach):
In regards to holding to expiration and not managing trades, we estimate that it would take 18.2 profitable trades to recoup the worst loss of $2,808. Of course, these are just estimations, but they show how sizable the losses can be relative to the potential reward.
How many of the short strangles reached each loss level?
Almost half of the strangles reached the 50% stop-loss level, which is incredibly high and likely a frequency that most traders would not prefer.
25% of the strangles reached the 100% stop-loss level and 16% of the trades reached the 200% stop-loss level. The data indicates that nearly 66% of the trades that reached a 100% loss also hit the 200% loss level.
Consequently, it may be logical to use the tighter 100% stop-loss as any strangle that reaches that loss level is likely to experience more severe losses.
SPY Short Strangles: Taking Profits
Now that we’ve explored the usage of stop-losses when selling strangles on the S&P 500, let’s look at the historical performance implications of closing profitable trades early.
We’ll use the same methodology as before:
Sell a 16-delta strangle on SPY in the expiration closest to 60 days away.
Management: None, 25% Profit Target, 50% Profit Target, 75% Profit Target.
Next Entry Date: First trading day after previous trades were closed.
For instance, if a strangle was sold for $3.00, a 25% profit would be reached when the strangle’s price decreased to $2.25 (a 25% decrease from the entry price). A 50% profit would be reached when the strangle’s price decreased to $1.50 (a 50% decrease from the entry price).
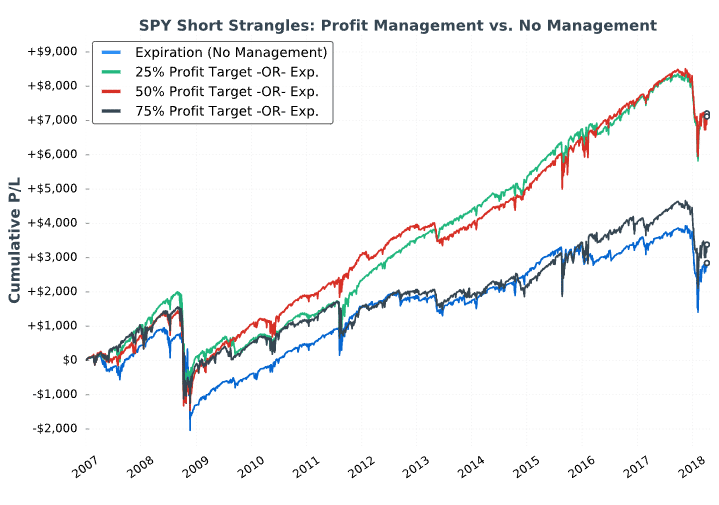
Here were the results:
*Please Note: Hypothetical computer simulated performance results are believed to be accurately presented. However, they are not guaranteed as to the accuracy or completeness and are subject to change without any notice. Hypothetical or simulated performance results have certain inherent limitations. Unlike an actual performance record, simulated results do not represent actual trading. Also, since the trades have not actually been executed, the results may have been under or over compensated for the impact, if any, or certain market factors such as liquidity, slippage and commissions. Simulated trading programs, in general, are also subject to the fact that they are designed with the benefit of hindsight. No representation is being made that any portfolio will, or is likely to achieve profits or losses similar to those shown. All investments and trades carry risk.
Taking profits at 25-50% of the maximum profit potential significantly increased the consistency of returns relative to not managing trades at all.
As expected, taking profits sooner resulted in higher success rates, fewer days held, yet larger losses compared to holding to expiration.
When taking profits sooner, trades are held for fewer days, which means there’s a greater chance of seeing a substantial market decline shortly after entering a new trade. This matters because if the market is steadily rising, taking profits on a strangle and selling a new one typically means the short put’s strike price will be closer to the stock price. As a result, larger losses can be experienced.
Another downside of managing profitable strangles early is that the profits are smaller but significant losses are still possible, which can dramatically increase the number of profitable trades needed to recoup large losses:
Pros and Cons of Closing Profitable Strangles
Benefit #1
‘Reset’ the strike prices more often. Results in more neutralized position deltas over time and reduces the probability of loss from market increases (since holding market-neutral positions for longer periods of time can lead to losses from upward market drift that’s typically observed).
Benefit #2
Reduce P/L Volatility by avoiding the high gamma exposure short strangles can have close to expiration (if the stock price is near one of the strike prices).
Benefit #3
Higher percentage of profitable trades, which can be beneficial from a psychological standpoint.
It’s not all good when it comes to closing short strangles early.
Here are the downsides of closing profitable trades sooner:
Con #1
Resetting the strike prices more often. After selling a strangle, a quick drop in the stock price will lead to larger losses relative to a scenario where the stock price rises first and then falls significantly (which is more likely when holding positions longer because the market typically drifts higher).
Con #2
More trades = more commissions. By exiting trades quicker, new trades are opened sooner as well, which leads to significantly more trades over time (and therefore more commissions).
Con #3
Higher required success rate when taking smaller profits. By closing trades for small profits, more profitable trades are required to recoup the losses from unprofitable trades, especially if the loss far exceeds the chosen stop-loss.
Selling Strangles on the S&P 500: Combining Profit & Loss Management
Hopefully, you’ve learned a great deal about how simple profit-taking and loss-taking approaches can potentially improve performance when implementing market-neutral options strategies such as the short strangle.
Selling Strangles on the S&P 500: Combining Profit & Loss Management
Hopefully, you’ve learned a great deal about how simple profit-taking and loss-taking approaches can potentially improve performance when implementing market-neutral options strategies such as the short strangle.
Now, we’ll examine the historical performance of combining profit targets and stop-losses.
Study Methodology
Product: S&P 500 ETF (ticker: SPY)
Expiration: Standard monthly cycle closest to 60 days to expiration.
Trade Setup: Sell the 16-delta call and 16-delta put. One strangle sold for all trades.
Management:
✓ 25% Profit OR 50% Loss
✓ 50% Profit OR 50% Loss
✓ 25% Profit OR 100% Loss
✓ 50% Profit OR 100% Loss
For example, if a strangle was sold for $4.00 and a trader used the 25% Profit OR 50% Loss management, they’d close the strangle if the price reached $3.00 (a 25% profit) or $6.00 (a 50% loss).
Here were the results of the four short strangle management strategies:
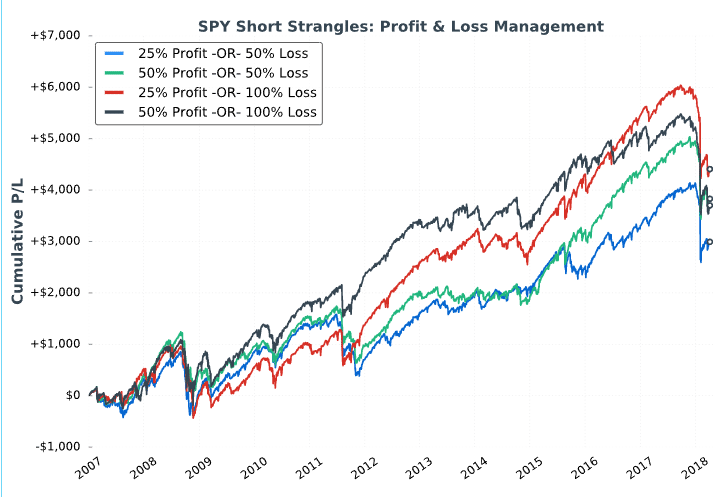
As we can see, all four of the management strategies performed well over the test period, though all strategies suffered major losses in February of 2018.
The strategies with the wider 100% stop-loss performed more consistently over the entire test period relative to the tighter stop-loss approaches.
As expected, the strategy with the highest success rate was the one with the smallest profit target and largest stop-loss (25% profit or 100% stop-loss).
All strategies suffered the same maximum loss of 434% relative to the premium received, which is due to the fact that all approaches closed profitable trades on the same date and entered the same position on the following trading day. The largest loss occurred during the February 2018 market crash.
How did the 100% stop-loss approaches compare to not managing trades at all?
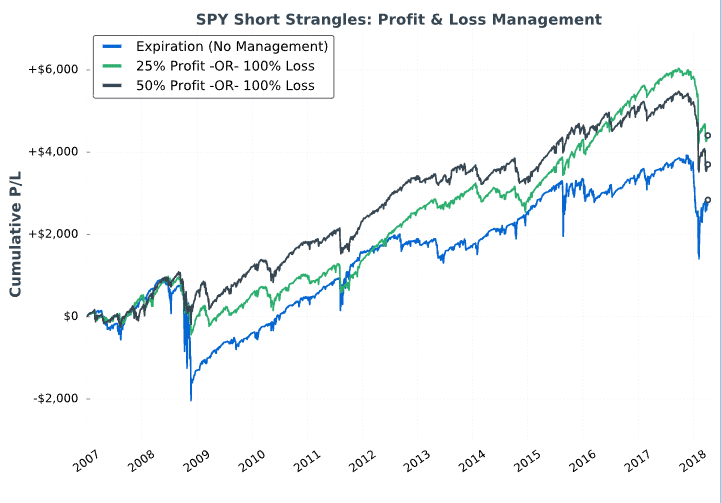
Using profit and loss management rules significantly improved the consistency of selling strangles on the S&P 500 over time. More importantly, the drawdowns were typically much less severe, with the exception of the February 2018 market crash.
During lower implied volatility environments (such as 2013 to early 2018), taking off profitable trades sooner led to much more consistent results compared to holding trades longer. It makes sense, as the market is typically grinding higher during low implied volatility environments (which is why implied volatility is low). When selling strangles in low IV environments, the short call’s strike price is typically very close to the stock price, which makes it much easier for the position to realize losses as a result of market appreciation (which is usually occurring when the VIX is low).
Here’s the same chart from above but with the VIX Index plotted against the strategies:
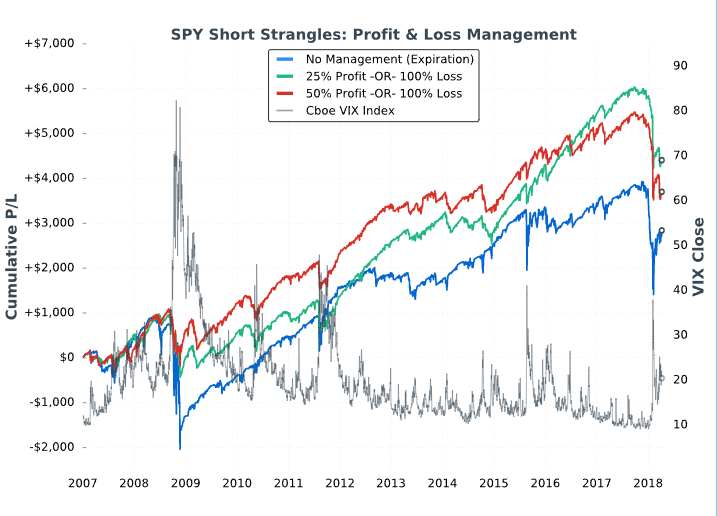
It’s important to note that while all of the above approaches show profits after the entire test period, all approaches suffered substantial losses at times, especially during February of 2018.
Over a long enough period of time, there will be market crashes worse than what was experienced in 2008, 2015 and 2018.
With that said, short strangles carry substantial risk and should be implemented with extreme caution (if at all). Undefined-risk strategies like short straddles and strangles are far riskier than what most traders are comfortable with, especially when increasing trade size.
Always think about risk before making any trades, and keep in mind that losses can become severe very quickly when selling naked options.
In any case, using profit and loss management rules when selling strangles can substantially improve consistency and lead to smoother growth curves over time

