Last updated on March 24th, 2025 , 03:44 pm
The Vertical Spread Options Strategies: Beginner Basics
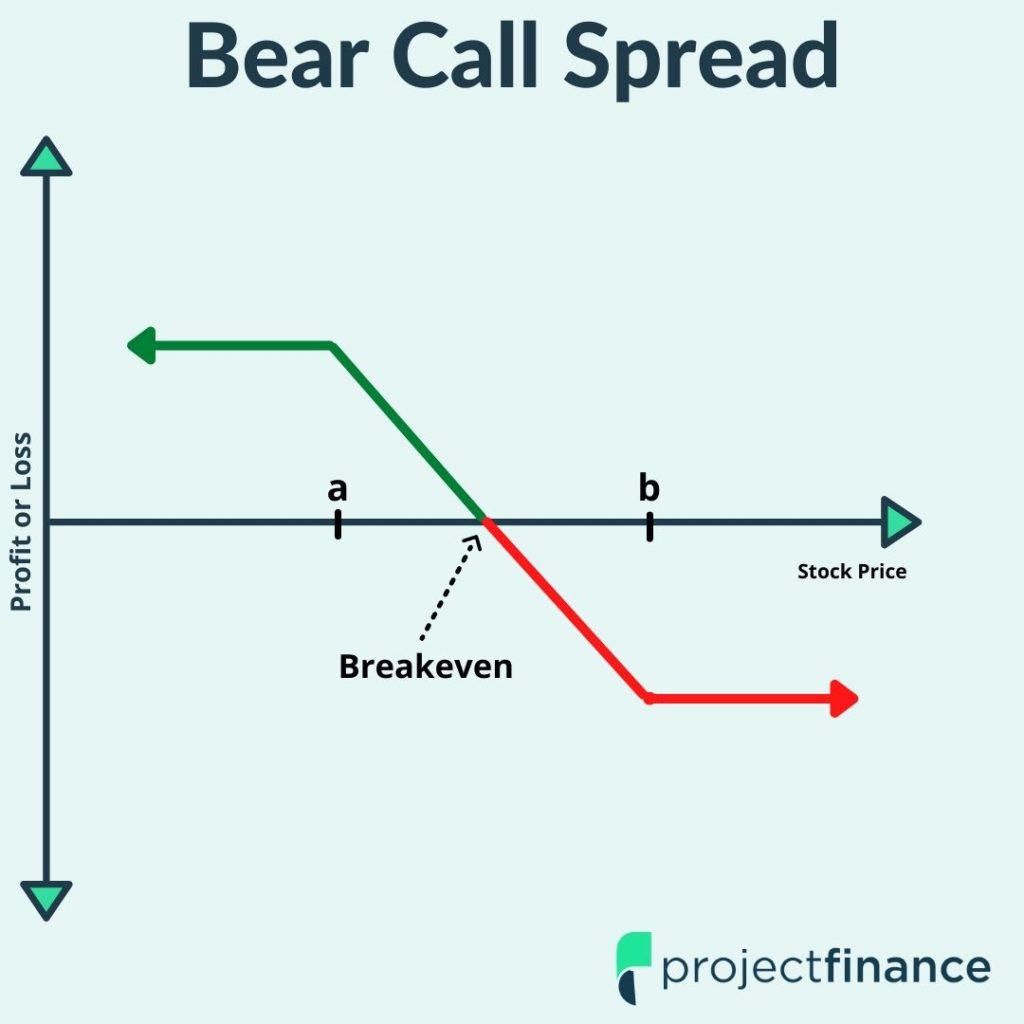
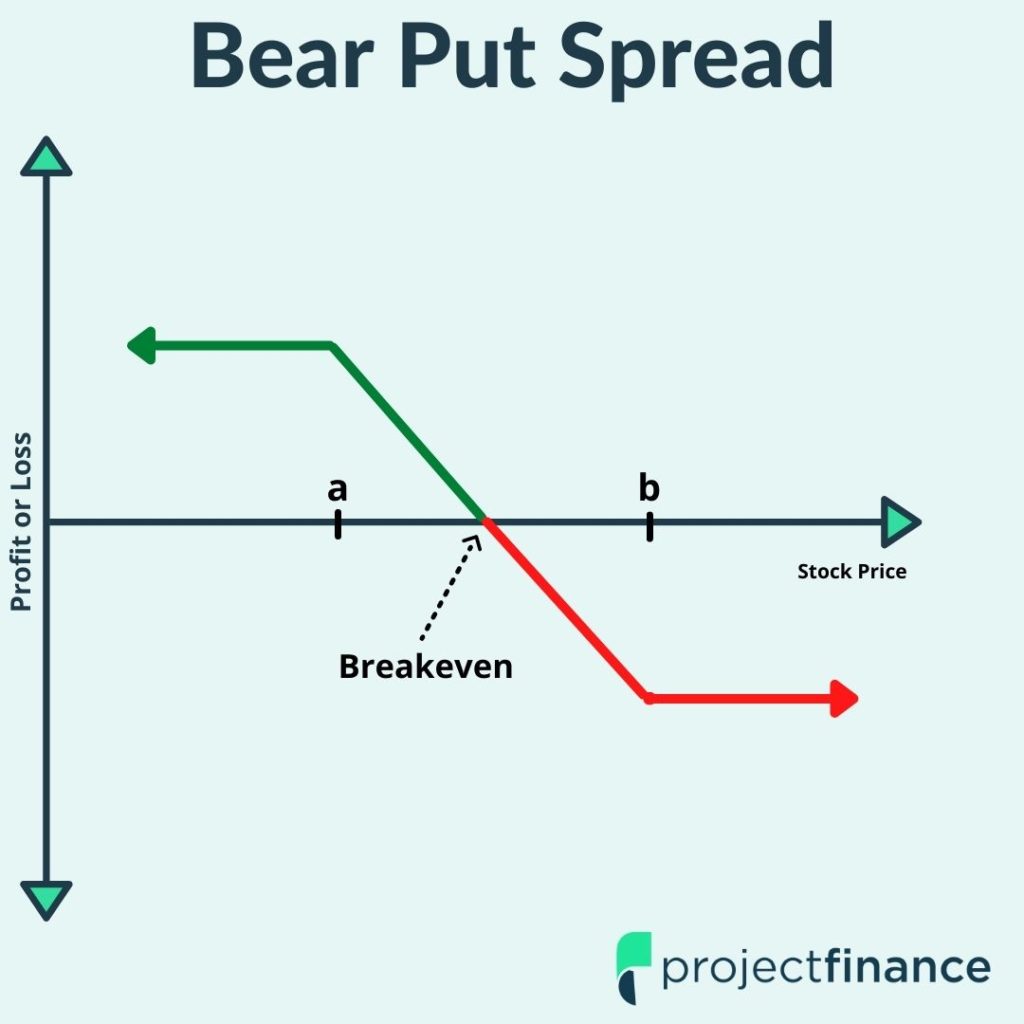
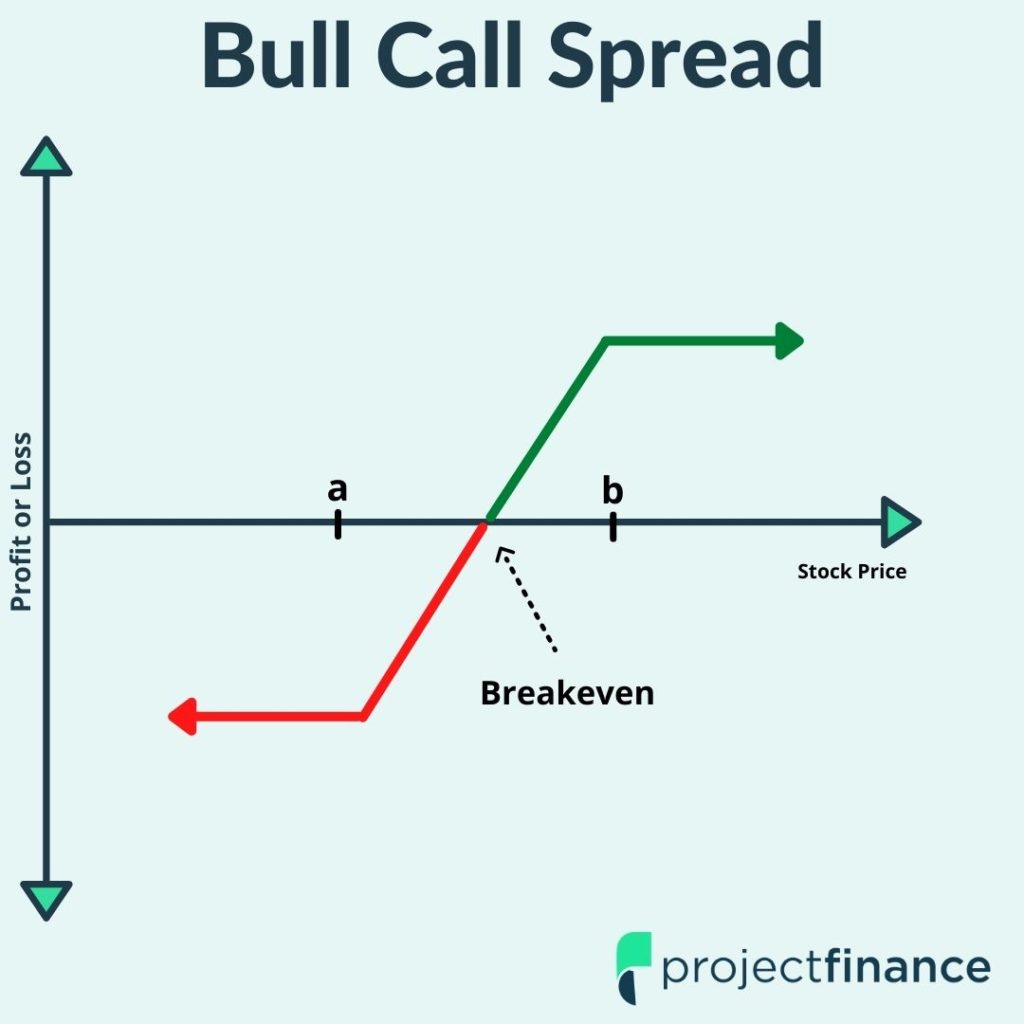
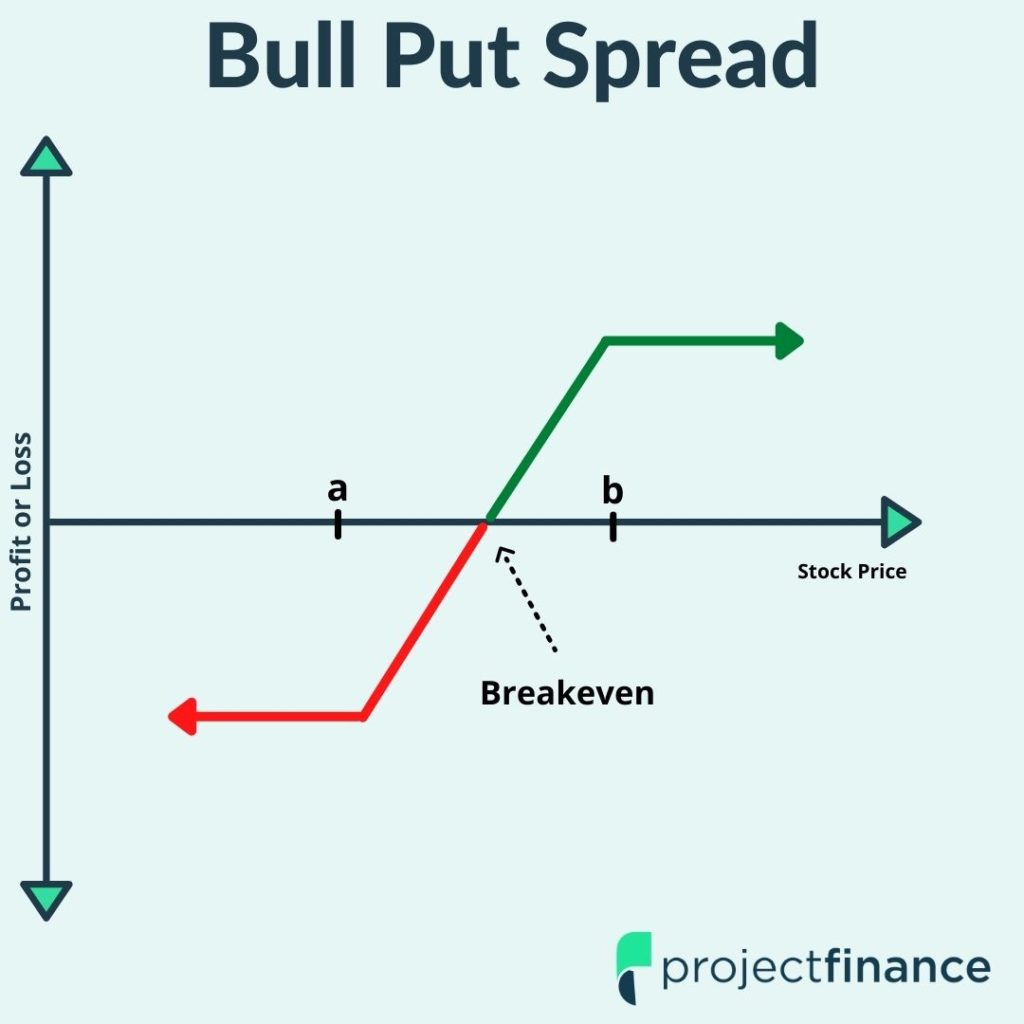
Vertical Spread Definition: In options trading, a vertical spread is a strategy that involves both buying and selling options of the same type (call or put) and expiration cycle, but at different strike prices.
There are dozens of different types of options trading strategies. Amongst the most popular of these are the vertical spread strategies.
If you’re able to master the 4 vertical spread option strategies, tackling more advanced trades such as the “iron condor” will be a piece of cake. In fact, having a firm grasp on how these basic types of strategies work will allow you to understand 80% of all options strategies!
We will be teaching the 4 vertical spread strategies in this article through numerous visual examples as well as trade performance illustrations to fully demonstrate how these strategies respond to changes in stock price and the passage of time.
Prefer to watch the video rather than read the article? No problem! Check it out below.
Article Prerequisites
If you’re brand new to options trading, this article isn’t the place to start. This video assumes you have a solid grasp upon how single options trade (long/short calls and puts) as well as slightly more advanced topics such as intrinsic and extrinsic value.
This article is actually the second installment of an options education tutorial. The first segment of the course is “Options Trading for Beginners”.
Below, you will find the popular video version of the course (10 million+ views!), as well as the write-up version.
Understanding the topics listed in the above material is crucial to understand what we will be talking about below.
For those that are ready to move on, let’s get started!
Highlights
- A vertical spread is an options strategy that combines the purchase and sale of two options simultaneously.
- Both options in a vertical spread must be of the same expiration and quantity.
- Vertical spreads offer investors a great way to reduce both cost and risk as opposed to trading single options.
- The bull call spread is a bullish options strategy constructed with call options consisting of the same expiration and quantity.
- The bull put spread is a bullish options strategy constructed with put options consisting of the same expiration and quantity.
- The bear call spread is a bearish options strategy constructed with call options consisting of the same expiration and quantity.
- The bear put spread is a bearish options strategy constructed with put options consisting of the same expiration and quantity.
Vertical Spread Definition: In finance, a vertical spread is an options strategy that combines the purchase and sale of two options simultaneously.
So what options will we be buying and selling?
- Purchase (long) an option at one strike price
- Sell (short) an option at a different strike price
In order to be considered a vertical spread, both options in the spread must fall under the same type of option (call/put), meaning that they must both be calls or both be puts. You can’t have a vertical spread with one call and one put; that would make it a different kind of spread.
Additionally, both options must be of the same expiration date and quantity. If the options were of different expiration, the spread would be considered a “diagonal” spread; if the options were of mismatched quantities, the spread would be considered a “ratio” spread.
Therefore, in order for a spread to be considered a vertical, the below criteria must be met:
- Both options are either calls or puts
- Both options expire on the same date
- The options are the same quantity
Here’s how both a vertical call spread and put spread appear:
Call Spread Example: Buy the AAPL June 140 Call, Short the AAPL June 150 Call
Put Spread Example: Buy the NFLX July 525 Put, Short the NFLX July 500 Put
Setting up a Vertical Spread on tastytrade
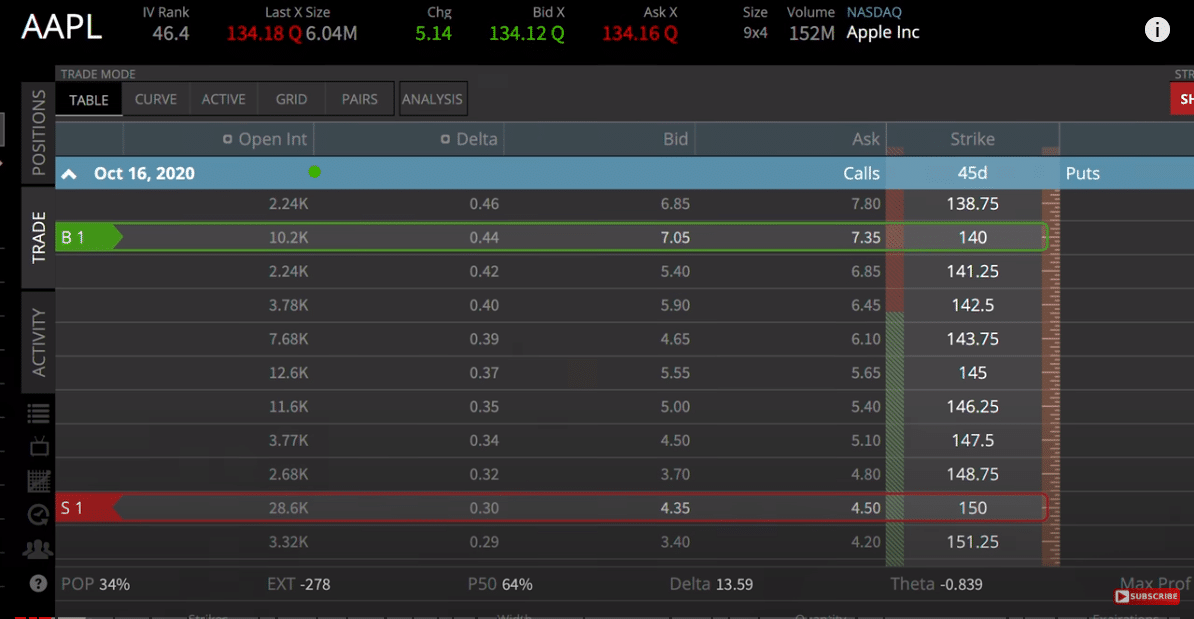
Let’s next take a look at how that would look in your trading software. The below screenshot (as all of our platform screenshots) is from tastytrade, our preferred broker.
So in the above example, you can see we selected the Oct16 140 call and the Oct16 150 call (highlighted in red and green). Notice how we chose the options “vertically” on the chain? One option is above the other. Additionally, both options are of the same expiration, class, and quantity. Therefore, this is the initial setup for a vertical spread.
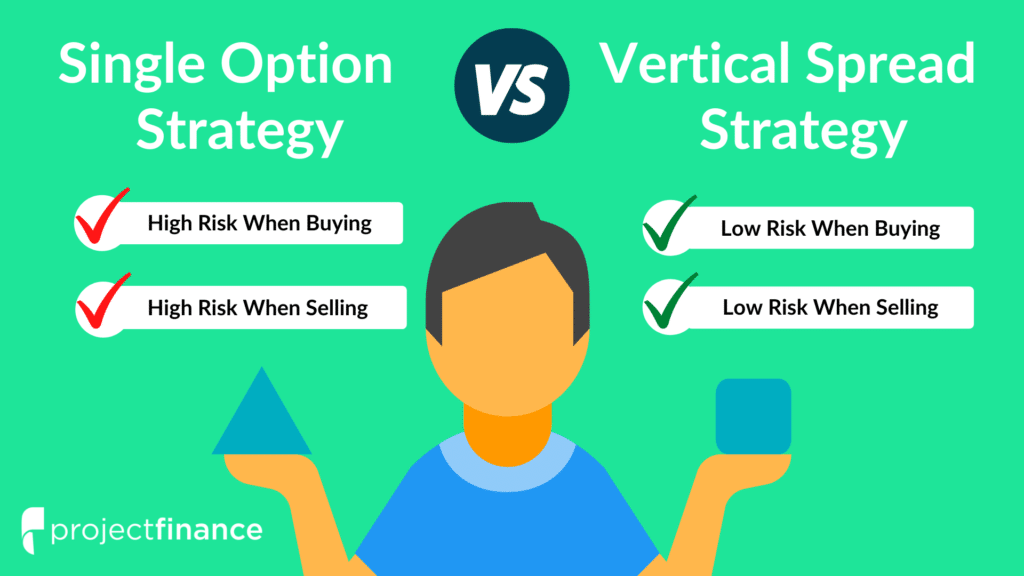
Many beginner options traders wonder why spread trading is even necessary; if we are bullish on a stock, why not just outright buy the call? Why bother with selling an additional call, thus reducing our maximum profit?
Why Trade a Vertical Spread? (Single Options vs. Spreads)
In order to fully understand the benefit of spread trading over single options trading, we need to return again to the tastytradetrading platform.
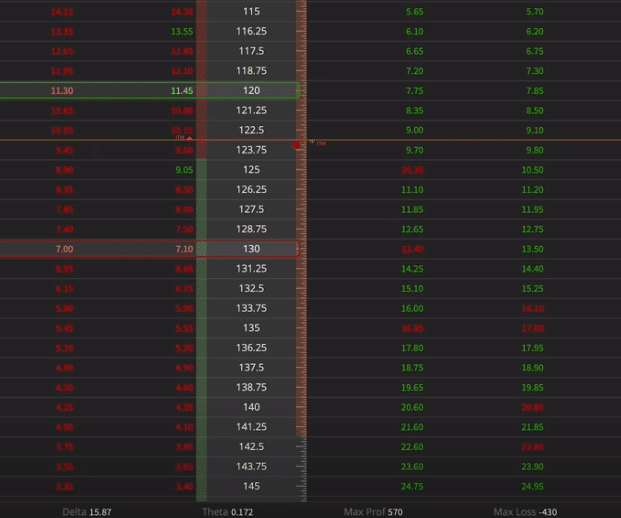
In the above options chain on, we have highlighted two options. The option in green is the AAPL July 120 Call. If we were to buy this option, it would cost us about $11.45.
So let’s say we purchase that option. What is our max loss? Well, since the option can go to zero, our max loss is therefore the complete premium of $11.45.
Now let’s take a look at the option in red, which is located “vertically” down the options chain from the 120 call. Here we see the AAPL July 130 call. Remember, in order to create a spread you must buy one option and sell another option. Since we are buying the 120 call, we are selling the 130 call.
We learned our max loss was $11.45 on the long call; but what would our max loss be if we sold a call against our long? Simply take the debit paid (11.45) and subtract the premium received from the short option (7.00) gives us a net debit paid of 4.45.
Therefore, selling the 130 call against the 120 call reduces our max loss down to $4.45 from $11.45!
Vertical Spread Advantage
Many traders prefer vertical spreads when compared to outright buying options because vertical spreads:
- Reduce the trades loss potential
- Increase a trader’s probability of making money
Are you beginning to see why vertical spreads make sense?
Of course, there is a trade-off for this reduced risk, and that comes in reduced reward. The maximum profit on a long call is infinite; the maximum profit on a vertical spread is fixed.
We will cover all of this more thoroughly later on.
Next up, we are going to get to the core of vertical spreads by studying each one individually.
The Bull Call Spread (Call Debit Spread)
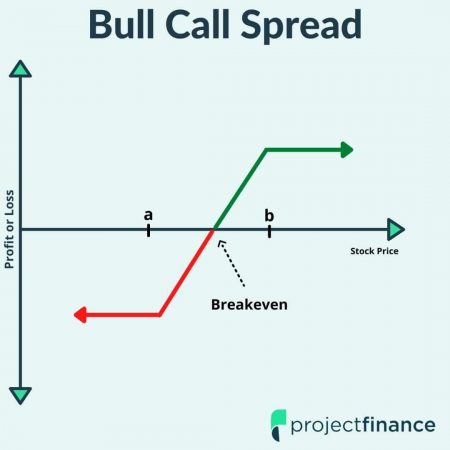
Bull Call Spread Definition: The bull call spread is a bullish options strategy constructed with call options consisting of the same expiration and quantity.
Spread Components:
Buy a call option at one strike price
- Sell another call at a higher strike price
Aliases:
- Bull Call Spread
- Buying a Call Spread
- Call Debit Spread
How a Bull Call Spread Makes Money
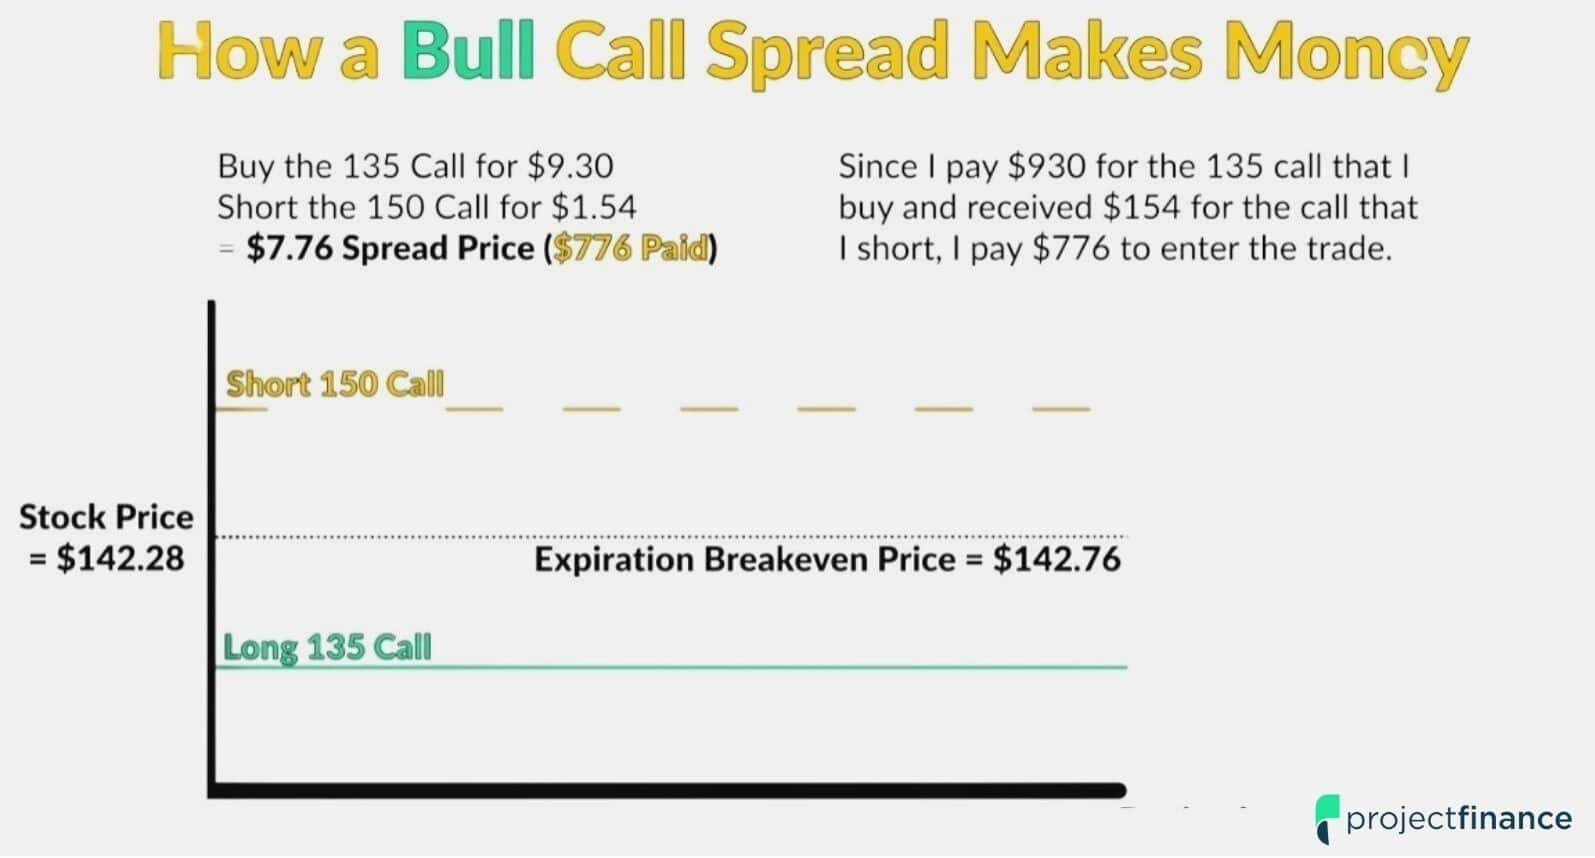
In order to understand how a bull call spread profits, let’s take a look at an example. A visual of our trade is provided below, as well as our trade details.
Trade Details:
Stock price at entry = $142.28
Call spread construction = Buy the 135 call for $9.30, short the 150 call for $1.54. Both options are in the 46-day expiration cycle.
Spread Purchase Price = $7.76 ($776 capital requirement)
Let’s first focus on the two most important parts: the options themselves.
Long the 135 Call for $9.30
Short the 150 Call for $1.54
So we are paying 9.30 for a call, then selling another call for 1.54. If we were only to buy that call, the cost of the trade would be $930. But since we are selling a call against this long option (thus creating a call spread) the cost of our trade will be reduced by this credit received.
Bull Call Spread Cost of Trade
In order to get the true cost (and risk) of a debit spread, simply subtract the credit received from the debit paid.
Debit paid – Premium Received = Cost of Debit Spread
$9.30 – $1.54 = $7.76.
In our Options Trading for Beginners Tutorial, we explained how one option contract represents 100 shares. Therefore, in order to get our true cost of a trade, we must multiply the trade cost by 100, or simply move the decimal point two places to the right.
A trade cost of $7.76 would therefore cost us $776. Additionally, this is the total amount of risk we have for this position.
The most important concept to understand in options trading is risk. Let’s next take a look at the risk profile for bull call spreads by seeing how the spread reacts to changes in stock price and time.
Bull Call Spread Risk Graph.
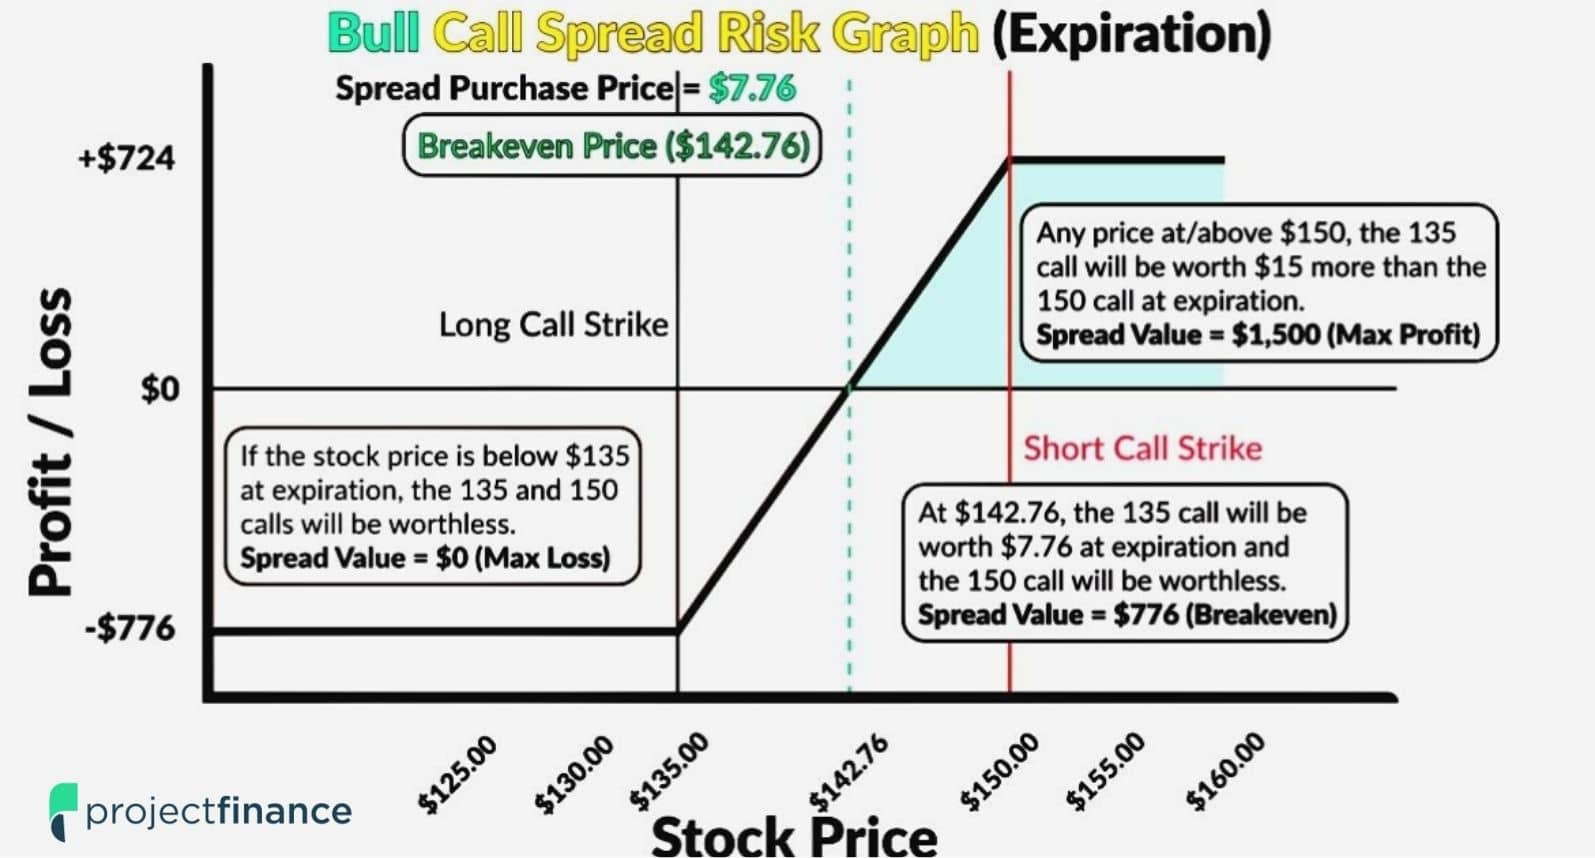
Below, you will find the risk graph for our trade.
Bull Call Spread Maximum Loss
Perhaps the most important component of this trade is its total risk. The risk on bull call spreads is limited to the debit paid. If you pay $7.76 for a call spread, you will only ever lose $776. Period!
This “max loss” scenario will occur if the stock is at or below $135 on expiration. This scenario is outlined on the bottom left portion of the above graph.
Bull Call Spread Breakeven
So we figured out how much this trade will cost us ($776) but at what point will that stock need to be trading in order for us to breakeven? The equation to determine breakeven for a bull call spread is:
Breakeven Stock Price = Purchased Call Option Strike Price + Total Premium Paid
So let’s just plug our data in here now.
135 (purchased call option strike price) + $7.76 (total premium paid) = $142.76 (breakeven stock price).
So we need the stock to be trading at $142.76 at expiration in order for us to breakeven. If the stock is trading above this price, we will realize a profit; if the stock is trading below this price at expiration, we will realize a loss.
If you’re new to breakeven prices, please check out our video on this subject!
How to Get the BREAKEVEN PRICE for ANY Options Strategy
Bull Call Spread Max Profit
Lastly, we have by far the most interesting outcome: maximum profit.
Can you determine the max profit on your own? Remember, we paid $7.76 for a spread that is 15 points wide (150 strike -135 strike =15).
The most you can make on a vertical spread is the width of the spread. Since this spread is 15 points wide (remembering the multiplier effect), the most we can make here is $1,500. This is illustrated in green in the upper right portion of our above risk graph.
But that doesn’t take into consideration the debit we paid! In order to calculate our maximum profit, we must therefore subtract the debit we paid. So $15-$7.76 gives us a maximum potential profit of $7.24, or $724.
If you’d like to understand how we reached this number better, read on. If you already understand it, skip ahead!
Why is a Vertical Spread's Max Value the Width of the Strikes?
The maximum potential value of any vertical spread is the distance between the strike prices.
The 135/150 call has a strike width of $15, therefore this spread can only ever make $15 ($1,500 when accounting for the multiplier). Why is this?
If the stock price is at $155 at expiration:
- The long 135 call will have $20 of intrinsic value ($155-$135)
- The short 150 call will have $5 of intrinsic value ($155-$150)
At expiration, the options will only have intrinsic value. Extrinsic value doesn’t survive expiration!
So at expiration, we can sell the 135 call for $2,000, but we’ll have to buy back the 150 call for $500.
Collect $2,000 – Pay $500 = Collect $1,500
That is the best-case scenario. Remember, we are indeed bullish on the stock, but if it rises too high, our short position will be ballast on our gains. If the stock is at $200 at expiration, we will still only ever make the width of the spread!
We talked earlier about the advantages of vertical spreads; now you see the downsides!
Bull Call Spread Net Profit
But will we realize $1,500 in profit? No! Remember, you paid $7.76 for the spread to begin with. Therefore, this debit must be subtracted from the width of the spread.
15 – $7.67 = $7.24 ($724) in maximum profit.
For all bull debit spreads, the formula for maximum profit is:
Bull Call Spread Maximum Profit = Difference between the strike prices (minus) the debit paid to put on the position.
So now that we have all the boring technical stuff out of the way, how did our call spread actually perform?
Bull Call Spread Trade Example (Real Data Visualization)
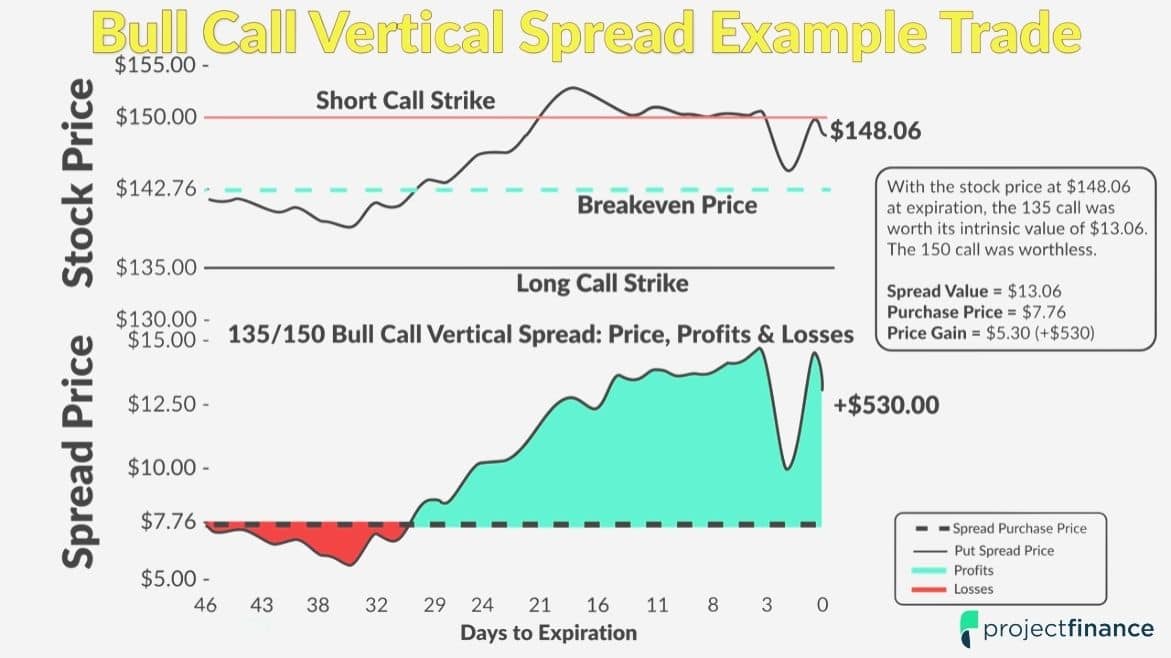
Take a moment to study the below graph.
On the top portion of this graph, you will see the changes in the stock price.
On the bottom portion of the graph, we are looking at the actual change in our spreads value over time.
If the spread price declines from the price we pay for it, we’ll have an unrealized loss. That’s what happened initially. Fortunately, we can see that the stock price soared higher in the subsequent weeks leading to an increase in the call spread value.
At around 4 days to expiration, the spread price closed in on its maximum value of $15.
Would this be a good time to close the spread? Sure! You can close a spread at any time. If you’re close to max profit, why take a risk with more time for the stock to move against you?
With about 2 days to expiration, we can see the stock did indeed move against us, cutting in substantially on our profits.
Call Spread Outcome: Calculating Profitability
At expiration, the stock price was $148.06. Remembering we have the 135/150 call spread on, can you guess our profitability?
Again, instead of resorting to formulas, think intuitively about this. The most we can make (not counting our premium paid to enter the trade) is $15. This happens when the stock closes above $150 at expiration.
But the stock closed below this level. Therefore, our $15 maximum profit is reduced by the amount the stock is under $150. In this case, it would be 1.94 (150-148.06).
Now, simply subtract this amount from the 15 point spread (15-1.94), which gives us a profit of $13.06.
But how much did we pay for the spread? The premium is always considered. If you sell a car, don’t you factor in the purchase price to determine your profit/loss?
In this trade, our purchase price was $7.76. Now subtracting this from the profit of $13.06, gives us a net profit of $5.30, or $530.
When you purchase a bull call spread, you will achieve maximum profit when the stock price closes above the spread’s upper strike price. We just missed that price here.
Closing a Call Debit Spread
Options trading is not static. Prices are in constant flux with the market. You are able to exit an options position whenever the market is open. You don’t have to wait until the option expires to take action; you can in theory trade out of an options position a second after opening it.
So how would we close our above call spread early? By selling it!
This is done quite simply by creating the opposite trade of the one you initiated. This can be done in one single transaction. You can always “leg” out of a spread, but that will leave you with more exposure during the time when only one leg is open.
NOTE: Stop-loss orders on option(s) are not recommended as horrible fills commonly result
Ok, let’s now move on to the next vertical spread strategy!
The Bull Put Spread (Put Credit Spread)
So know that we know what a bull call spread is, let’s move onto the bull put spread.
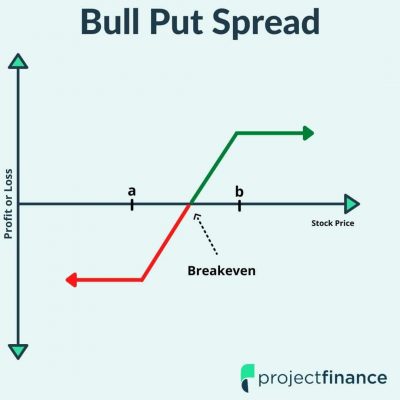
Bull Put Spread Definition: The bull put spread is a bullish options strategy constructed with put options consisting of the same expiration and quantity.
Spread Components:
Short a put option at one strike price
- Buy another put option at a lower strike price
Aliases:
- Bull Put Spread
- Shorting/selling a Put Spread
- Put Credit Spread
This strategy is similar to our bull call spread in that they are both bullish on the market, meaning that if the market goes up, they both make money. However, that’s where the similarities end. There are three main differences between bull call spreads and bull put spreads:
- Bull put spreads consist of all put options
- The long option in the bull put spread is below the price of the short option
- A net credit is the result of a bull put spread. (A bull call spread creates a debit)
Since we are selling this spread (as outlined in the third bullet above), a net credit is received. That is why this trade is called a credit spread. Whenever you receive a premium for a spread, it’s a credit spread; whenever you pay a debit, it’s a debit spread.
How a Bull Put Spread Makes Money
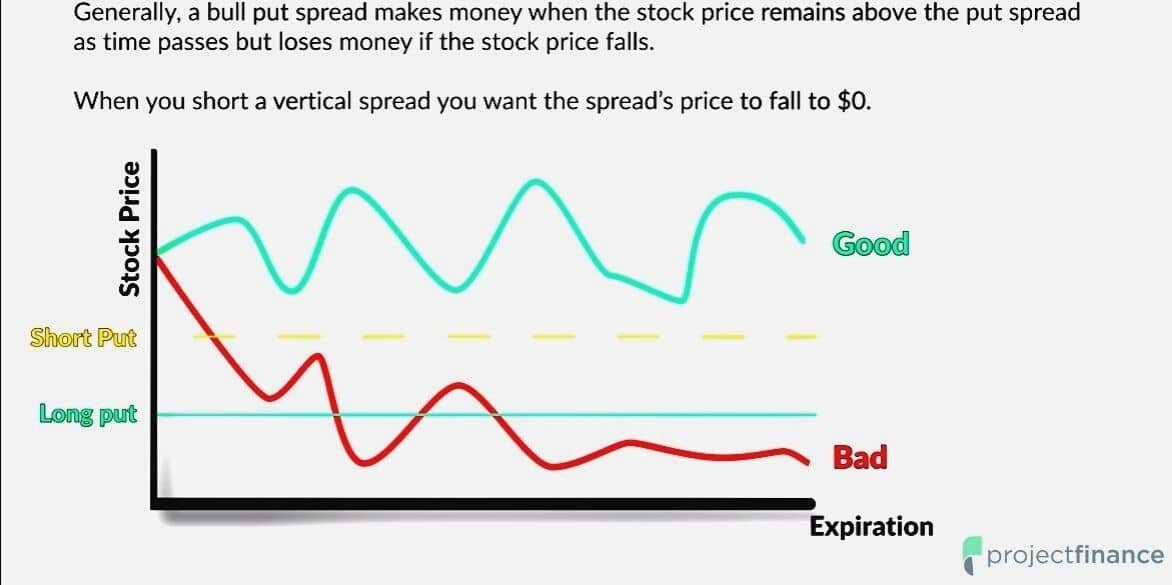
A bull put spread makes money when the stock rises in value, ideally above the strike price of the put sold. Take a minute to study the below image.
Bull put spreads tend to have a high probability of success. In theory, you have a greater than 50% chance of making money on these types of spreads (when done the traditional way).
Let’s take a closer look to better understand this.
Bull Put Spread Setup Visualization
The below graph illustrates a bull put spread:
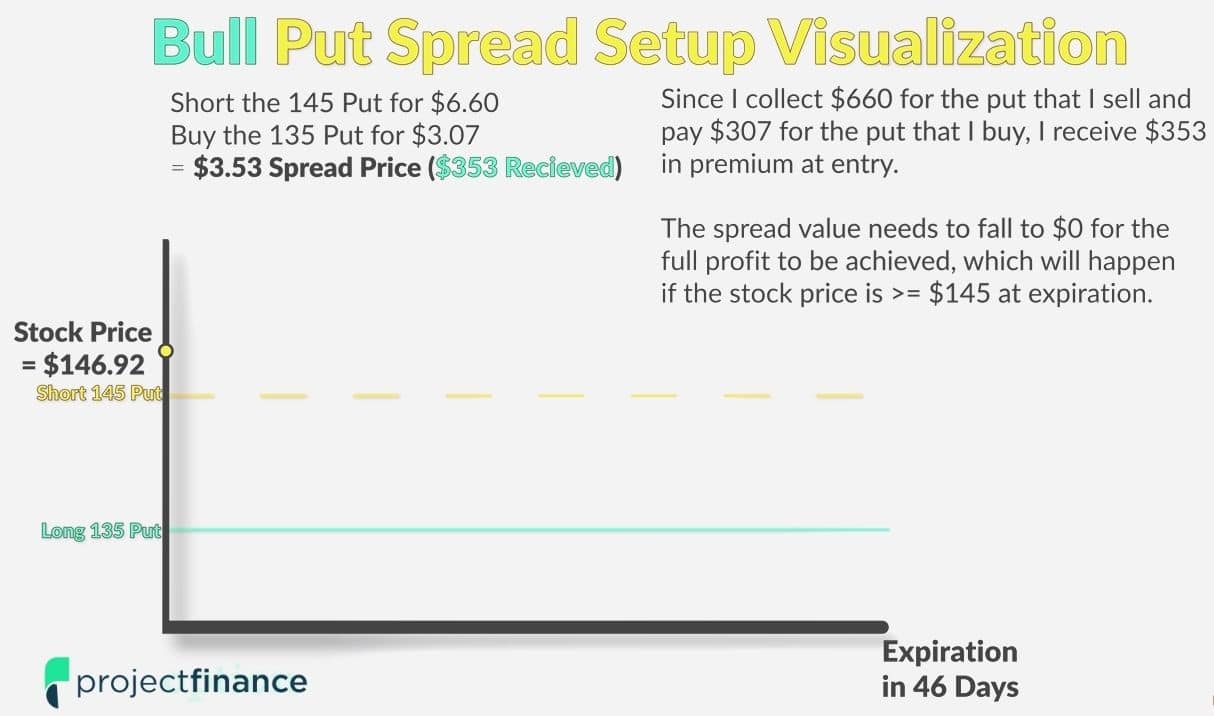
In this example, the stock is trading at $146.92 at the time of trade entry.
Our position is a follows:
Stock price at entry =$146.92
Put spread construction = Short the 145 put for $6.60, buy the 135 put for $3.07
Spread sale price = $3.53 credit received
Key to note here are two factors:
- Both options are in the 46-day expiration cycle (remember, all vertical spreads have the same expiration date!)
- Since we short the 145 put and collect $6.60 and buy the 135 put for $3.07, a net premium is collected at entry.
Let’s next cover how the maximum profit, maximum loss and breakeven profiles for bull put spreads are calculated.
Bull Put Spread Maximum Profit Potential
Just like in our bull call spread example, we want the price of the stock to go up here. But the mechanics here are a little different. Since we are selling a spread, we want the options that compose that spread to go down in value.
When do put options go down? When the stock goes up of course. Therefore, our maximum profit occurs when the options are trading at the least value, or zero. They will both be worth zero if the stock closes above our short put strike price of 145 on expiration.
So if the stock indeed closes above 145, how much will we make? The credit received. Whenever you sell options, your maximum profit is always the credit received.
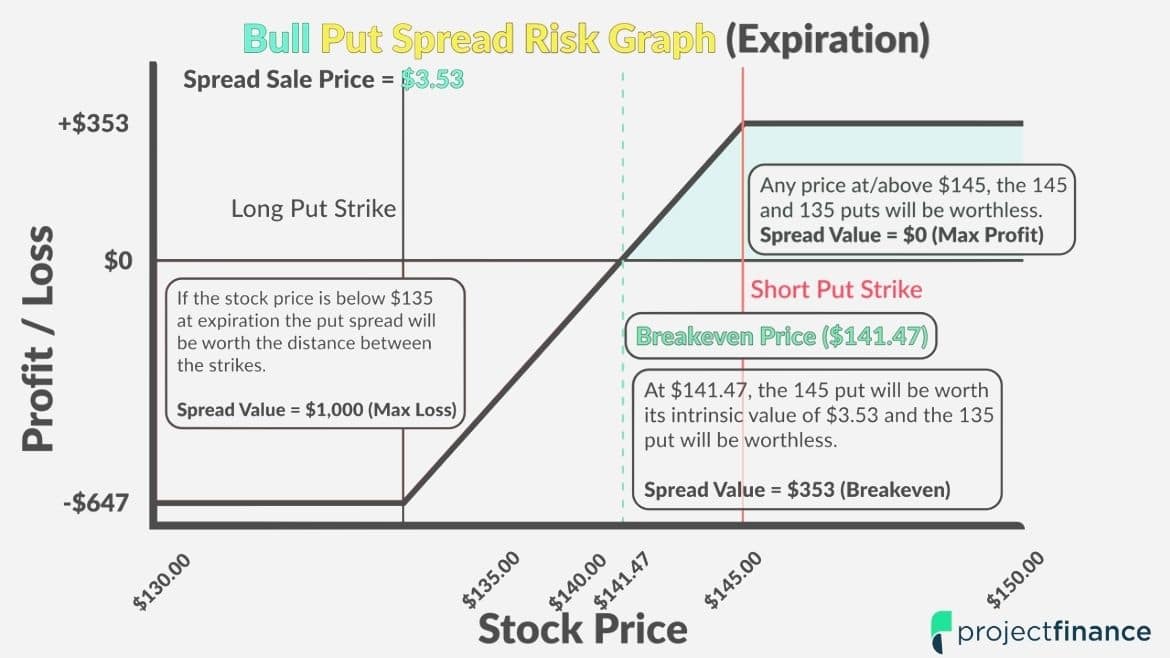
Our maximum profit is therefore $353 (our credit received).
Bull Put Spread Maximum Loss Potential
So what about if the trade goes against us? How much can we lose?
We mentioned earlier that this type of trade has a greater than 50% chance of success. The downside to this high probability of success is reflected in the trade’s maximum loss.
Maximum loss on credit spreads is calculated by subtracting the premium received from the width of the spread. We sold a 10 point spread for $3.53. Our maximum loss is, therefore (10-3.53) $6.47, or $647 in premium. That’s almost twice our maximum profit! It better have a higher chance of winning than losing for that risk!
Bull Put Spread Breakeven Price
The breakeven price for a bullish put spread is calculated by subtracting the premium received from short strike price. Our breakeven is therefore 145-3.53 = 141.74.
Let’s next take a look at these various outcomes in the risk graph.
So what actually happened to this spread in real life as time passes? Let’s check that out next.
Bull Put Spread Trade Example (Real Data Visualization)
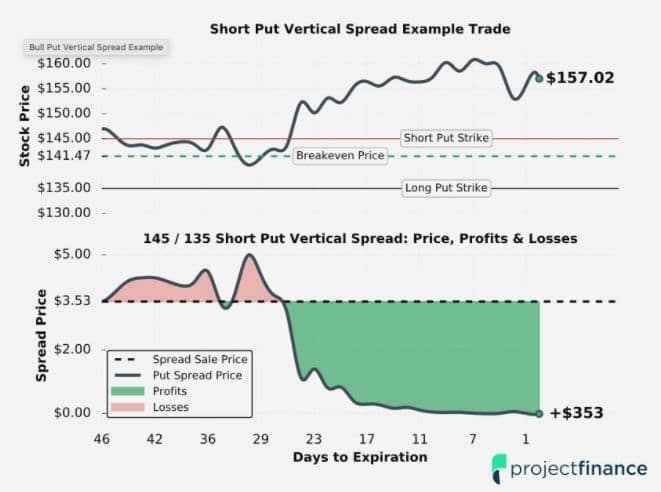
Here’s how our trade performed in real time:
The top portion of this graph features the changes in the stock price relative to the spread’s strike prices.
As we can see early on in the trade, the share price was falling, which caused an increase in the put spread’s price. Since the bull put spread is a bullish strategy, it will lose money when the stock price falls, and make money when the stock price rises.
Fortunately, the shares regained traction and headed higher throughout the remainder of the trade. We can see as time passed and the stock price increased, the spread’s value collapsed.
Closing a Bull Put Spread
At around 17 days to expiration, the spread’s value was very close to $0, which means the trade essentially reached maximum profit.
At that moment, a wise trader would close the put spread to secure the profit. Closing the trade would entail buying back the short 145 put and selling the long 135 put. The P/L on the trade would be the difference between the $353 premium collected at entry and whatever we paid to close the spread. If we paid $20 to close the spread, the profit on the trade would be $333.
But as we can see, the spread continued losing value and ended up with the maximum profit at expiration.
With the stock price at $157.02 at expiration, the 145 put and 135 put had no intrinsic value, and therefore the spread’s value was $0. If a trader held this spread through expiration, both of the options would simply disappear from the account and the trader would be left with the $353 profit.
So far we’ve covered both of the bullish vertical spread strategies. Let’s take a look at a few bearish spread strategies next.
The Bear Call Spread (Call Credit Spread)
These last two strategies on our list are both bearish vertical spreads, which make money as the stock price falls.
The first of these two strategies is the bear call spread, which is a bearish vertical spread constructed with call options.
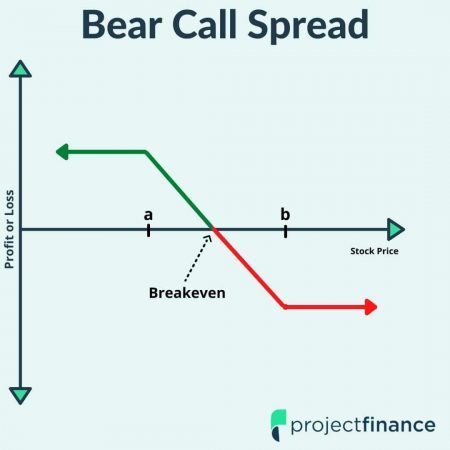
Bull Call Spread Definition: The bear call spread is a bearish options strategy constructed with call options consisting of the same expiration and quantity.
Spread Components:
Short a call option at one strike price
- Buy another call option at a higher strike price
Aliases:
- Bull Call Spread
- Shorting/Selling a Call Spread
- Call Credit Spread
How A Bear Call Spread Makes Money
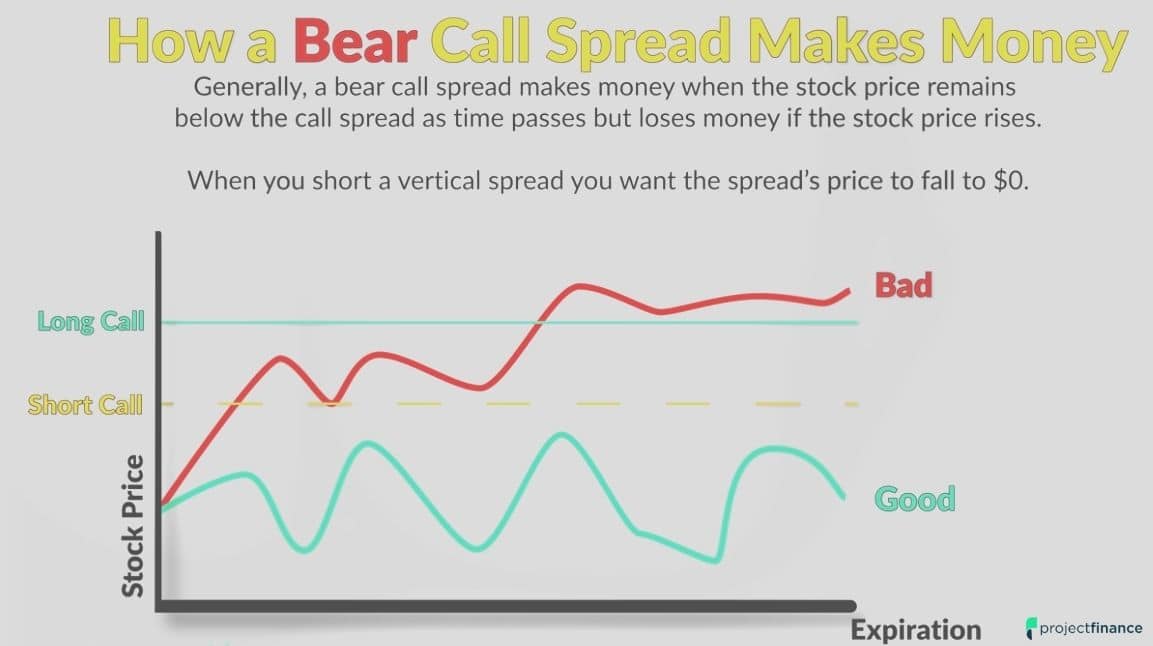
This bearish trade makes money as long as the stock price remains below the call spread’s strike prices. It is therefore similar to the bull put spread we just looked at, except it works in the exact opposite way.
Remember, instead of buying a call spread, we are selling a call spread here. We are simply taking the other side of the trade we talked about earlier. As long as the stock price remains below the strike prices of our position, we will make money.
Let’s take a look at an example now.
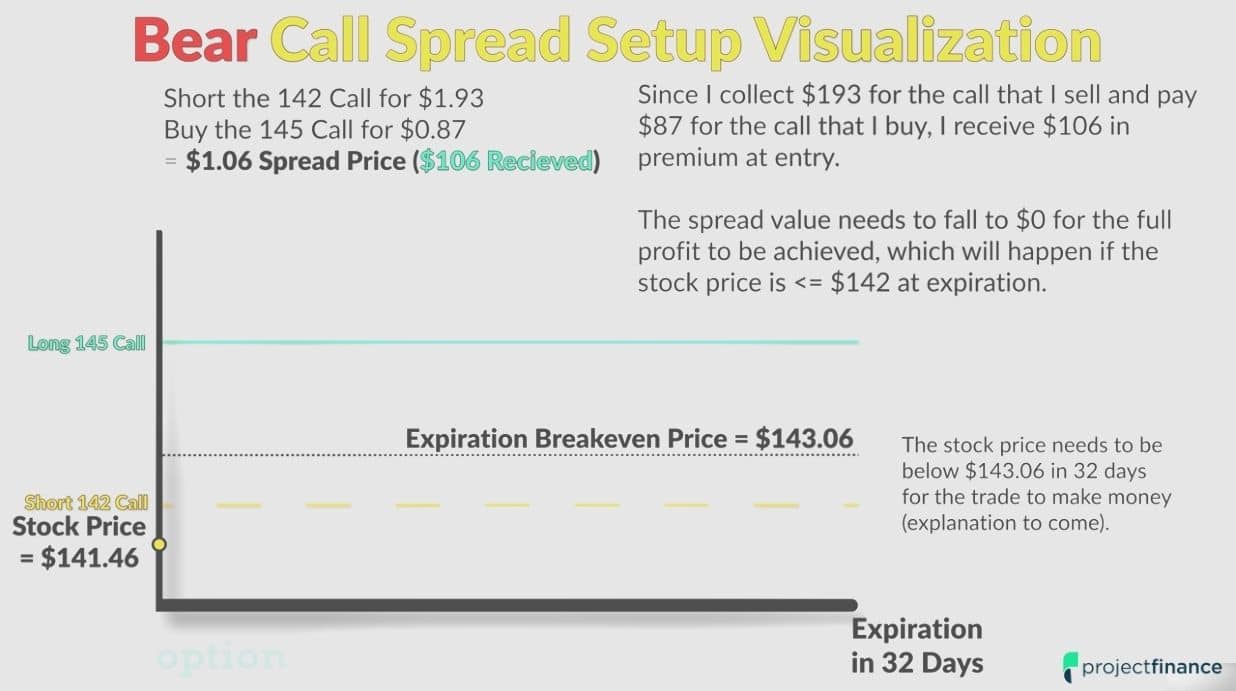
Bear Call Spread Setup Visualization
Here is a visual of our bear call spread trade, proceeded by the trade details.
Stock price at entry =$141.46
Call spread construction = Short the 142 call for $1.93 buy the 145 call for $0.87
Spread sale price = $1.06 credit received
So what we have here is a 3 point call spread sold for a net credit of $1.06. Since we are bearish, we believe the stock price is going to go down. Since the call we sold was valued more than the call we purchased, this trade results in a net credit, and is therefore a credit spread. The most we can ever make is the credit received.
Let’s next take a look at the different ways this trade can play out.
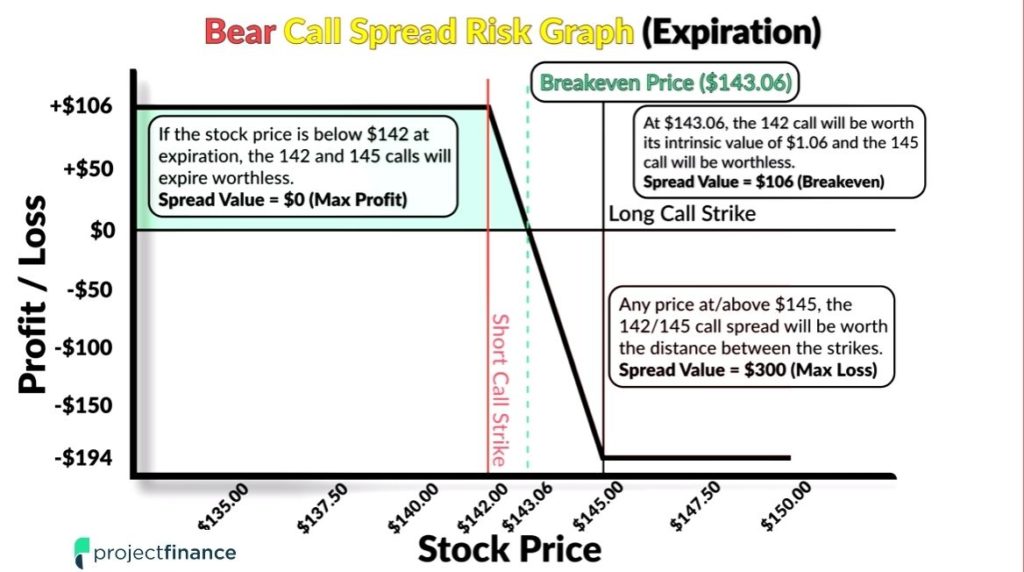
Bear Call Spread Risk Graph at Expiration
The below chart represents the various outcomes of our trade.
Bear Call Spread Maximum Profit
Max profit for any credit spread is always the credit received. Therefore, our max profit in this scenario is $1.06, or $106 in premium.
Bear Call Spread Maximum Loss
To determine the maximum loss on a credit spread, simply subtract the credit received from the width of the spread. We sold a three point spread for $1.06, therefore our max loss is (3-1.06) 1.94, or $194.
Bear Call Spread Breakeven
To determine the breakeven on a bear call spread, add the net credit received to the short call option. Since we sold the 142 strike price and receive a net credit of $1.06, our breakeven is therefore (142+1.06) $143.06
Let’s now exit the land of theory and see how our trade actually performed!
Bear Call Spread Trade Example (Real Data Visualization)
Take a moment to study the graph below, which illustrates how our above trade performs over time.
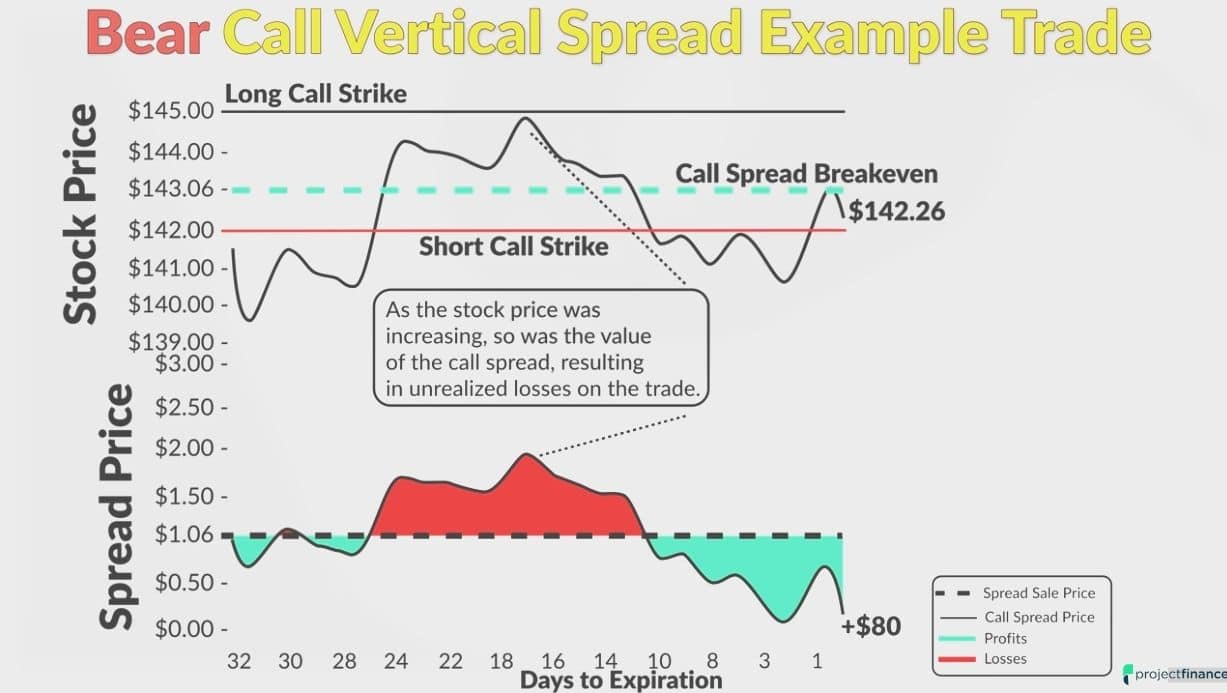
The first thing to note is the correlation between the stock price and the spread price. Since this is a bearish call spread trade, we want the stock price to fall below the 142 price level by expiration.
About halfway through this trade, with 17 days to expiration, we can see the stock price was approaching the $145 price level. The spread value here was $2.00, representing a $94 unrealized loss at that moment.
But later, after the passage of a few weeks, the stock price declined steadily.
With 2 days to expiration, the stock price was below the call spread’s strike prices and the spread price itself was almost $0. With the best-case scenario being that the spread price falls to $0, it makes sense to close the spread here. Take the risk off!
Closing a Bear Call Spread
To close a short call spread, you need to buy back the short call and sell the long call. In this trade, that would mean buying back the short 142 call and selling the long 145 call. This can be done in the same transaction.
Opening Trade: Short the 142 call, buy the 145 call
Closing Trade: Buy back the 142 call, sell the 145 call
If we paid $0.20 to buy back the spread, our profit would be $86 because we initially shorted the spread for $1.06.
In terms of this spread’s value at expiration, the stock price was at $142.26, which means the 142 call had intrinsic value of $0.26 and the 145 call expired worthless.
Therefore, the price of the 142/145 bear call spread at expiration was $0.26, or a real value of $26.
If we shorted the spread for $1.06 and it had a value of $0.26 at expiration, our profit would be $80.
Ok, let’s move on to our last vertical spread strategy!
The Bear Put Spread (Put Debit Spread)
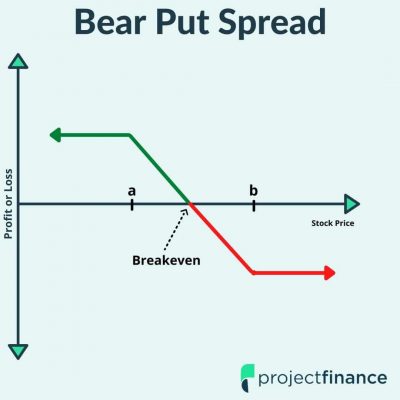
The final vertical spread strategy is the bear put spread, which is a bearish vertical spread constructed with put options.
Bear Put Spread Definition: The bear put spread is a bearish options strategy constructed with put options consisting of the same expiration and quantity.
Spread Components:
Buy a put option at one strike price
- Sell another put option at a lower strike price
Aliases:
- Bear Put Spread
- Buying a Put Spread
- Put Debit Spread
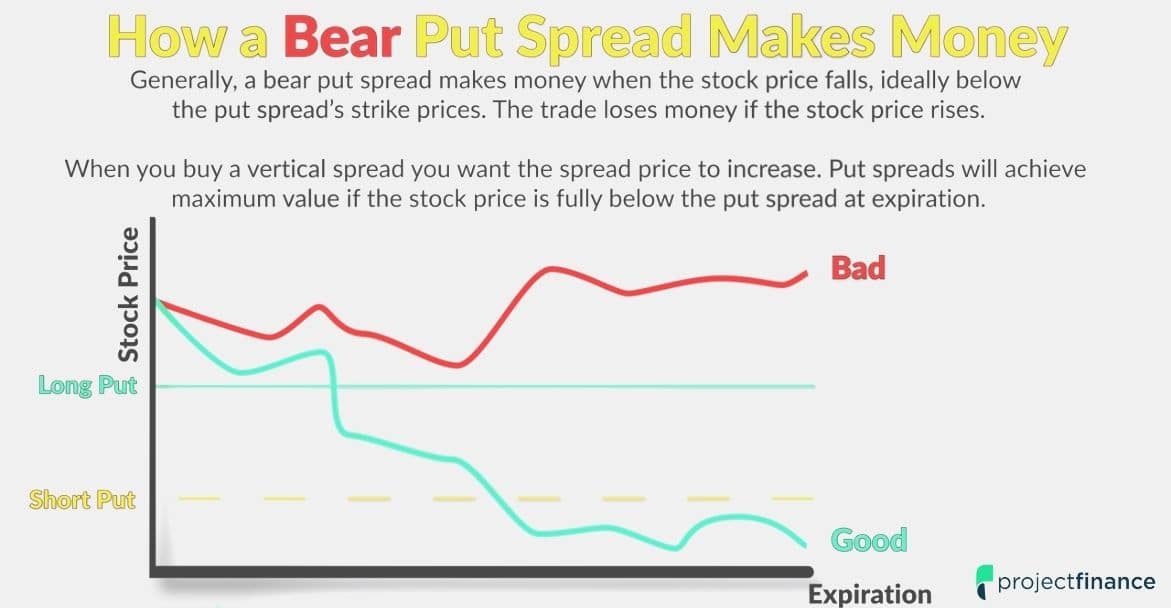
How A Bear Put Spread Makes Money
Bear put spreads typically make money when the market falls. Since our position involves a “debit” as well as “puts”, we are essentially long puts, which means we believe the market will go down.
Since the put that we purchased cost more than the put that we sold, this position will require a debit to enter. Therefore, it is a debit spread.
Let’s now move on to an example.
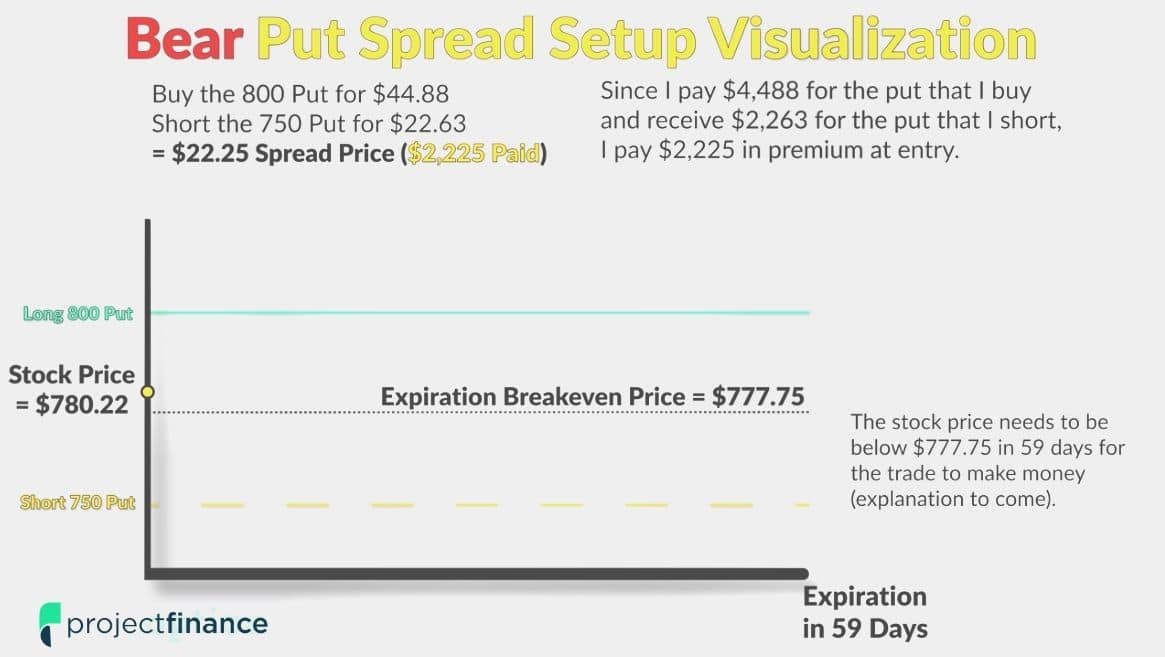
Bear Put Spread Setup Visualization
The below image is a visualization of our trade, proceeded by our trade details.
Stock price at entry =$780.22
Put spread construction = Buy the 800 put for $44.88, Short the 750 put for $22.63.
Spread sale price = $22.25 debit paid
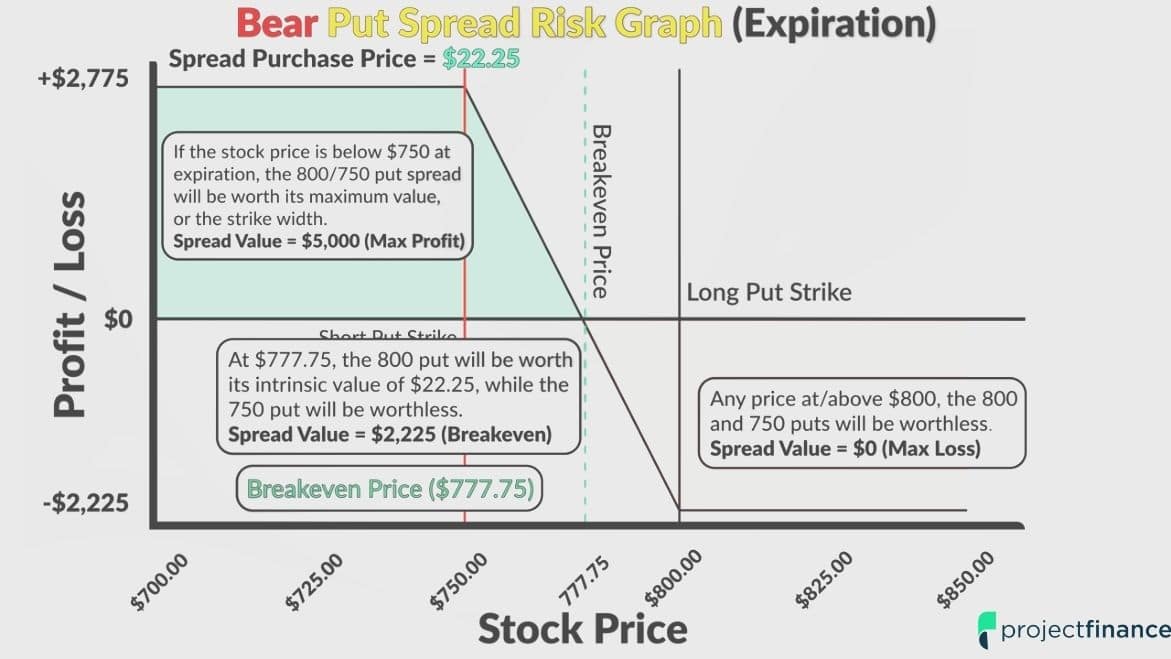
Bear Put Spread Risk Graph at Expiration
Before we get into the different trade outcomes, take a moment to look at the bear put spread risk graph below.
Bear Put Spread Maximum Profit
The best-case scenario is the stock price falling below $750 and remaining there at expiration. In that scenario, the put spread will be worth the distance between the strike prices, which is $50. If we buy a 50 point put spread for $22.25 and it appreciates to $50, we’ll have a gain of $27.75 on the spread. If we multiply that by 100, we get a profit of $2,775.
Bear Put Spread Maximum Loss
The worst-case scenario is that the stock price is above both put strikes at expiration, in which case both options will have no intrinsic value and expire worthless. In this scenario, we’d end up having a worthless spread which we paid $2,225 for in the beginning, leaving us with a 100% loss
Bear Put Spread Breakeven
The breakeven price at expiration is $777.75. If the stock price is right at $777.75 at expiration, the 800 put that we own will have intrinsic value is $22.25 and the 750 put that we’re short will be worthless.
Therefore, the spread’s price will be $22.25 and we’ll have no profit/loss at expiration.
Next, let’s see what actually happened to this position in the real world!
Bear Put Spread Trade Example (Real Data Visualization)
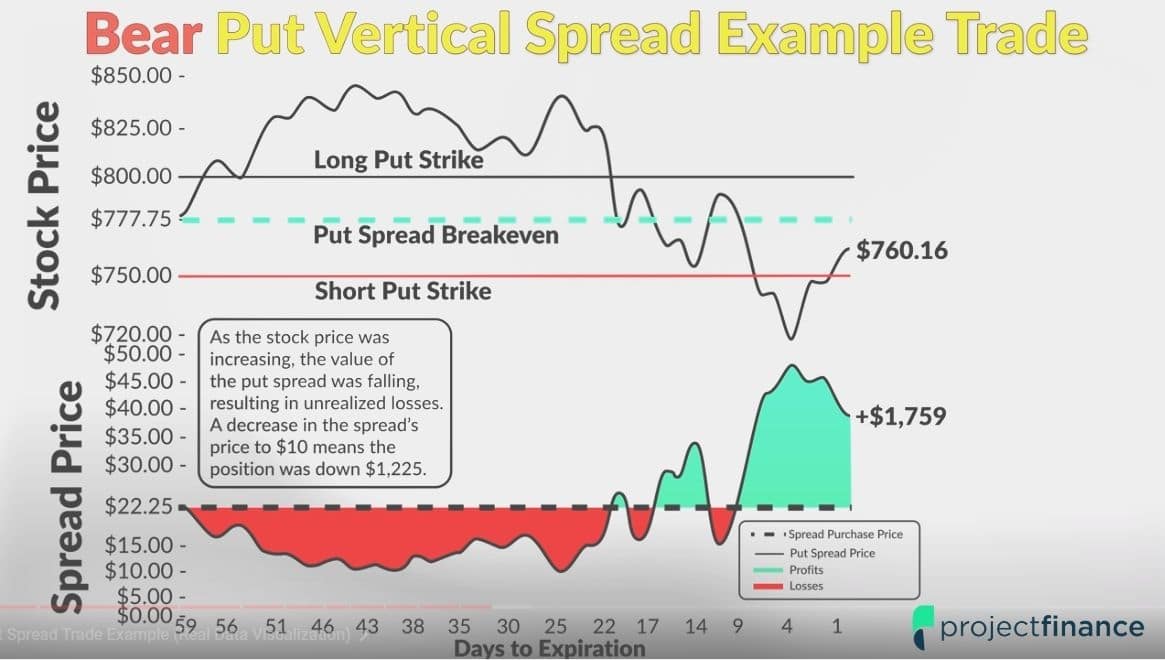
The below chart illustrates how our bear put spread reacts to changes in the underlying stock price.
Understanding this is a bearish strategy, it makes sense that the trade lost money initially as the stock price was increasing.
When you buy a put spread, you want the price of the spread to increase, which happens as the stock price falls, ideally below both strike prices of the put spread.
Bear Put in Stock Rally
In the first two weeks or so, the stock price went from $778 to almost $850, and the 800/750 bear put spread’s price fell from $22.25 to a low of $10.00.
This decrease to $10 represents a $1,225 unrealized loss on the spread because we initially paid $2,225 for the spread. A reduction in its price to $10 means the spread is worth $1,000. Remember, we always have to multiply the spread’s price by 100 to get its dollar value.
As luck would have it, the stock rally did not last long, and the share price plummeted over the remainder of the trade.
Bear Put in Stock Decline
We can see that at 14 days to expiration, the stock price was just above $750, which implies the 800/750 put spread was almost fully in-the-money.
The spread’s price at that moment was around $34, or a value of $3,400.
The stock price fell even further, reaching a low price of $720 when the spread had 4 days left until expiration. At that moment the spread’s price was around $47.50, or $2.50 short of the maximum value of $50.
Closing a Bear Put Spread
We could have sold the spread at that moment for $4,750 and secured a profit of $2,525. To close a put spread that you’ve purchased, you just sell the put spread.
In this example, that would be done by selling the 800 call and buying back the short 750 call.
But if we held the position to expiration, our profit would have been $1,760.
Final Word
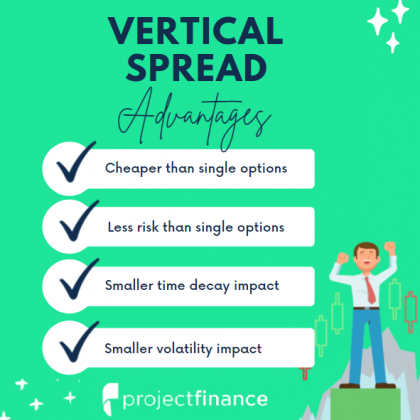
Spread trading offers investors both a reduction in risk and cost as opposed to trading single options. Additionally, in spread trading, changes in time decay and implied volatility impact the position less.
The first step when trading spreads is to determine the direction you believe the underlying security will be headed. We have gone over 4 types of vertical spreads so far:
Bullish Spread Strategies
- Bull Call Spread
- Bull Put Spread
Bearish Spread Strategies
- Bear Call Spread
- Bull Put Spread
Next up, you must determine the strike prices. Generally speaking, the risk of a trade increases with the widening of the strike price legs. A one-point spread will generally have less risk than a ten-point spread.
Should you have specific questions on your spread, make sure to reach out to the tastytrade trade desk. They are the best in the business!
Vertical Spread FAQ's
Vertical spreads are generally safer than buying or selling single options. For debit spreads, the risk is the total debit paid. For credit spreads, the total risk is the width of the spread minus the credit received.
It is possible to leg out of a vertical spread. Bare in mind that if you leg out of the long option first, that will leave you naked short an option, which can have considerable risk.
Long vertical spreads can be closed at any time. If held until expiration, it is important that both legs are either in the money or out of the money. One leg being in the money could result in assignment/exercise which will leave a net stock position in the account.
The credit spread strategy makes money when the options’ spread narrows. The debit spread strategy makes money when the spread widens.



2 thoughts on “The Vertical Spread Options Strategies: Beginner Basics”
Great read – thanks!
In your opinion, are buying or selling vertical spreads more profitable over the long run?
Thanks for the question Paul! Generally speaking, options fall in value over the long run. This is because of something called time decay, or “theta”. Because of this, long option strategies (like long vertical spreads) generally underperform short option strategies, such as short vertical spreads.