Average P/L Per Trade
Let’s take a look at the average profit/loss per trade in each iron condor management approach:
The lower profit percentage approaches saw a decrease in the average P/L per trade, which is what we’d expect when taking smaller profits while also allowing the same magnitude of drawdowns.
90th Percentile Losses
To compare the outlier drawdowns of each approach, we’ll examine the 90th percentile losses for each iron condor management combination. The 90th percentile loss tells us the loss level in which 90% of losing trades did not reach. In other words, only 10% of losses were worse than the 90th percentile loss.
As expected, the tighter stop-loss approaches had the shallowest drawdowns of any approach. In regards to the profit or expiration approaches, the 25% management had the worst 90th percentile drawdown, which indicates of the few trades that were losers, the losses were typically substantial. Losses were consistent in the loss-taking approaches.
Average Time in Trades
Though some iron condor management approaches have substantially higher average profits per trade, not all trades are held for the same amount of time. So, we need to account for the fact that more trades can be squeezed into each 45-day period when closed earlier for profits or losses.
Let’s take a look at the average time in trades for each approach, and then normalize the average profit per trade of each approach to a 45-day period.
Here were the average number of calendar days held for the trades in each approach:
As we’d expect, closing trades early for profits or losses results in less time in each trade. As a result, shorter average trade durations lead to more occurrences over time if a new trade is placed immediately after the previous one is closed.
Average P/L Per Trade (Adjusted for Time)
Let’s look at the average profitability of trades for each approach when normalized to a 45-day period. Here’s the calculation:
45-Day Adjusted Average P/L: Average P/L x (45 Days / Average Days in Trade)
When normalizing the average P/L per trade of each iron condor management approach, we find that there are many better alternatives to managing iron condors than simply holding to expiration (as the previous graphs may have suggested).
Based on these values, the 50-75% profit levels seem to stand out the most.
Commission Impact
Of course, we need to consider the commission impact of each approach. At this point, we’ve identified that the 45-day profit expectancy seems to be consistently high in the 50% and 75% profit-taking combinations. However, with more trade occurrences, commissions can become an issue, especially for an options strategy with four legs.
Let’s take a look at the 45-day expected commissions based on a $1 per contract commission schedule (no ticket/per-trade charge). Here’s the calculation for our commission estimations:
45-Day Commissions = (45 Days / Avg. Days Held) x $1 x 4 Contracts x 2 Trades (Open/Close)
= (45 Days / Avg. Days Held) x $8
As expected, the highest commissions occur in the lower profit/loss approaches, as those combinations generate the highest number of trades.
Average 45-Day P/L – 45-Day Commissions
Let’s look at the average 45-day P/L of each approach after taking out the estimated commissions over each 45-day period:
Wow! Before adjusting for commissions, it seemed as if each approach had similar P/L expectancy. However, after taking out the estimated commissions over each 45-day period, it becomes clear that taking profits at 25% may not be the most efficient strategy.
Of course, these figures will vary depending on your particular commission rate, but a $1/contract commission structure with no ticket charge is on the lower end of available commission structures.
In the next section, we’ll examine the 30-delta short option and 16-delta long option iron condor variation.
Results: 30/16 Iron Condors (30-Delta Short, 16-Delta Long)
You’ll notice that we’ve omitted the -300% loss level for this particular iron condor setup. We did this because the spread widths are much narrower than the 16-delta short / 5-delta long iron condors. Only 2.5% of trades had loss potential greater than 300% of the credit received. However, 25% of trades had loss potential greater than 250% of the credit received, so we did include the -200% loss level.
Overall, having 12 iron condor management combinations gives us 30,549 trades.
Win Rates: 30-Delta / 16-Delta Iron Condors
Here were the percentages of profitable trades in each iron condor management approach:
Compared to the 16-delta short option and 5-delta long option iron condor setup, the 30-delta / 16-delta iron condors realized lower success rates across the board. However, the 25-50% profit percentage approaches still realized high success rates, despite the iron condors having an approximate 40% probability of expiring worthless.
Let’s see how these win rates stacked up against the required breakeven win rates calculated from the average profits and average losses for each approach.
Win Rates – Breakeven Win Rates
Here are the differences between the realized success rates and required breakeven success rates for each approach:
Completely opposite of the 16-delta iron condors, the 25% profit percentage approaches for the 30-delta iron condors saw the highest margins over the required breakeven success rates. Conversely, the higher profit percentage approaches exceeded the required breakeven win rates by very thin margins.
The data suggests that when the short options are closer to the stock price (closer to ±0.50 delta), closing profitable trades early has been more favorable than closing at higher profit percentages.
Average P/L Per Trade
Let’s take a look at the average profit/loss per trade in each iron condor management approach:
As the Win Rate – Required Breakeven Win Rates would suggest, the 25-50% profit percentage approaches saw the highest average P/L per trade. Interestingly, the -200% loss category experienced higher average P/L than the no-loss approaches. This can be explained by the fact that -200% is near max loss for most of these iron condors. While locking in the maximum loss on a limited-risk spread isn’t very logical in practice, it’s still interesting to see that taking losses slightly lower than the maximum loss enhanced average profitability over the long-term.
90th Percentile Losses
To compare the largest drawdowns of each approach, we’ll examine the 90th percentile losses for each iron condor management combination. The 90th percentile loss tells us the loss level in which 90% of losing trades did not reach. In other words, only 10% of losses were worse than the 90th percentile loss.
As expected, the tighter stop-loss approaches had the shallowest drawdowns of any approach. The -200% loss combinations saw drawdowns very close to the no stop-loss approach of holding trades to expiration, which suggests the trades were closed without much more loss potential (not the most logical approach, but included nonetheless).
Average Time in Trade
As we did before, let’s examine the average time in trades for each approach, and then normalize the average profit per trade of each approach to a 45-day period.
Here were the average number of calendar days held for the trades in each iron condor management approach:
As we’d expect, closing trades early for profits or losses results in less time in each trade. As a result, shorter average trade durations lead to more occurrences over time if a new trade is placed immediately after the previous one is closed.
Average P/L Per Trade (Adjusted for Time)
Let’s look at the average profitability of trades for each approach when normalized to a 45-day period. Here’s the calculation for reference:
45-Day Adjusted Average P/L: Average P/L x (45 Days / Average Days in Trade)
When normalizing the average P/L per trade of each iron condor management approach, the 25% profit levels were the clear winners, with the 50% profit levels following close behind. But, as we know, we need to see the percentage of profits given back to commissions before determining the “optimal” management approaches.
Commission Impact
Like we did for the previous iron condor variation, let’s look at the 45-day avg. P/L when adjusted for commissions. Estimated commissions are based on a $1 per contract commission schedule (no ticket/per-trade charge).
First, here are the estimated 45-day commissions for each approach:
Consistent with the findings from the 16-delta iron condors, closing trades earlier (for a profit or loss) generates more overall occurrences in the same period of time. As a result, the commissions were the highest in the 25-50% profit percentage approaches.
Now let’s subtract these commissions from the 45-day P/L expectancy for each approach:
Opposite of the 16-delta iron condors, the 25-50% profit target combinations had the highest P/L expectancy when adjusted for commissions.
Iron Condor Performance by VIX Level
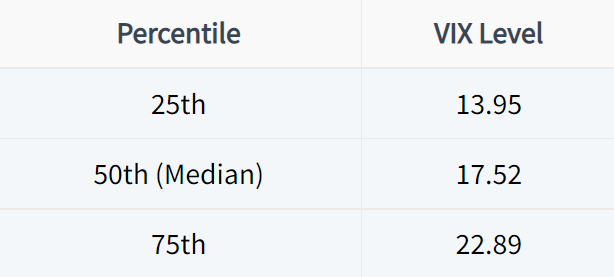
Now that we’ve examined the performance of two iron condor variations with 16 different management combinations, let’s filter the trades into four VIX buckets with an equal number of trades. To accomplish this, we’ll use the 25th, 50th, and 75th percentile of VIX levels over the test period to evenly divide the trades into four volatility buckets.
Here are the four VIX ranges for each bucket:
Low: VIX Below 14
Low-Mid: VIX Between 14 and 17.5
Mid-High: VIX Between 17.5 and 23.5
High: VIX Above 23.5
16-Delta Iron Condors vs. VIX at Entry
Let’s start with success rates:
The results show consistently higher success rates in trades entered when the VIX was below 17.5, with some management combinations realizing a spike in success rates when trades were entered in high implied volatility environments.
How do these success rates stack up against the required breakeven success rates (based on average profits and average losses)?
Win Rates – Breakeven Win Rates
Here’s the difference between the realized success rates and required breakeven success rates for each approach:
In the approaches that did not take losses, the highest margins of success rates over the breakeven success rates occurred in the low IV entries. The approaches that took losses with high profit targets exceeded the required breakeven success rate by the largest margin in the high IV entries.
The findings suggest that when iron condors are sold in high IV environments, the losses tend to be substantial relative to the profits (especially when closing profits early). By taking early losses on losing trades in high IV environments, the losses are kept manageable, while profitable trades drive solid returns on a per-trade basis.
In the next section, we’ll look at profit metrics for the trades in each volatility environment.
Average Profit/Loss Per Trade
Here were the average P/L figures for the iron condors in each approach:
The average P/L metrics tell us that managing losing trades in high IV environments substantially increased the overall profitability of trades, as losses were kept small while profitable trades enjoyed heightened gains.
Additionally, closing profitable trades at lower profit percentages in high IV environments had the worst performance, as profitable trades were cut short while losses were still substantial. The combination of these two things results in a high required win rate to break even, which makes it harder to profit over the long-term.
90th Percentile Losses
To validate previous statements, we’ll examine the 90th percentile losses for the iron condors in each volatility environment. The 90th percentile loss indicates the level that only 10% of trades exceeded. In other words, the 90th percentile loss is rare.
As we can see, the high IV entries saw the worst drawdowns in every single management approach. These loss figures help explain why taking losses in the higher IV entries substantially improved overall profitability per trade.
Average Time in Trade
Here’s the average number of calendar days held for the trades in each approach:
As we’d expect, closing trades early for profits or losses results in less time in each trade.
Average P/L Per Trade (Adjusted for Time)
Let’s look at the average profitability of trades for each approach when normalized to a 45-day period. Here’s the calculation:
45-Day Adjusted Average P/L: Average P/L x (45 Days / Average Days in Trade)
In low volatility environments, closing profitable trades early generated the highest average profitability over 45-day periods. The high IV entries saw the most profitability over 45-day periods in each loss-taking approach. This makes sense, as we know that the largest losses occurred during the high IV entries.
In the final section, we’ll examine how much commissions reduced the performance of each approach.
45-Day Average Profitability (Adjusted for Commissions)
Let’s take a look at the 45-day average P/L of each approach when adjusted for commissions over the same period. Commissions are based on a $1 per contract commission schedule. Here’s the calculation for the adjusted average profitability:
Number of Trades: (45 Days / Avg. Days Held)
Commissions Per Trade: 4 Options x $1 x 2 Transactions (Open/Close) = $8
45-Day Adjusted P/L: 45-Day Avg. P/L – (Commissions Per Trade x Number of Trades)
As we can see here, there are a few approaches with negative P/L expectancy when adjusting for commissions. All of the negative P/L approaches included taking profits at 25% of the maximum profit potential.
The highest P/L expectancies occurred in the loss-taking approaches when entered in high implied volatility environments.
As mentioned earlier, these figures will vary depending on your particular commission rate.
30-Delta Iron Condors vs. VIX at Entry
We’ll finish with the same analysis applied to the 30-delta short option / 16-delta long option iron condor variation!
Let’s start with success rates:
With the short options being much closer to the stock price at entry, closing profitable trades early significantly improved win rates. Furthermore, the larger stop-loss and expiration approaches saw the highest win rates in the lowest and highest VIX entries.
Win Rates – Breakeven Win Rates
Here were the differences between the realized success rates and required breakeven success rates for each approach:
Interestingly, most of the approaches that did not close profitable trades early realized win rates less than the required win rates to break even in the mid-level VIX entries.
The trades with the highest success rates relative to the required breakeven success rates were the high VIX entries, suggesting that selling options closer to the stock price has been beneficial in high volatility environments.
Average P/L Per Trade
Here were the average P/L figures for the iron condors in each approach:
Consistent with the positive Win Rate – Breakeven Success Rate approaches, the iron condor management combinations with the highest average P/L per trade were the high VIX entries.
90th Percentile Losses
How large were the losses in each volatility environment? Here were the 90th percentile losses for each approach:
Similar to the 16-delta iron condors, the largest losses were in the high VIX entries. However, there was less dispersion between losses in each volatility environment, which likely stems from the fact that the 30-delta iron condors have less overall risk relative to the potential reward.
Average Time in Trade
Here’s the average number of calendar days held for the trades in each approach:
As we’d expect, closing trades early for profits or losses results in less time in each trade.
Average P/L Per Trade (Adjusted for Time)
Let’s look at the average profitability of trades for each approach when normalized to a 45-day period. Here’s the calculation:
45-Day Adjusted Average P/L: Average P/L x (45 Days / Average Days in Trade)
By analyzing the 45-day adjusted average P/L for each approach, it becomes very clear that the 30-delta iron condor variation has historically performed very well in high implied volatility environments.
45-Day Average Profitability (Adjusted for Commissions)
Let’s take a look at the 45-day average P/L of each approach when adjusted for commissions over the same period. Commissions are based on a $1 per contract commission schedule. Here’s the calculation for the adjusted average profitability:
Number of Trades: (45 Days / Avg. Days Held)
Commissions Per Trade: 4 Options x $1 x 2 Transactions (Open/Close) = $8
45-Day Adjusted P/L: 45-Day Avg. P/L – (Commissions Per Trade x Number of Trades)
Consistent with previous statements, the high VIX entries were the clear winners in regards to the 30-delta iron condor variation.
Summary
We’ve just made it through a ton of data, so let’s quickly recap the most notable findings from this study!
Iron Condor Variation #1: 16-Delta Short Options & 5-Delta Long Options
In regards to the 16-delta iron condors, each approach appeared to have similar P/L expectancy when accounting for the number of trades that could be squeezed into a 45-day period. However, when adjusted for estimated commissions, the 50-75% profit target approaches stood out the most in terms of P/L expectancy:
When closing profitable trades for 50-75%, the number of overall trades increases since positions are closed faster. This allows traders to “re-center” their iron condor trades sooner, and position themselves in the next expiration cycle. However, the 50-75% profit target combinations do not churn trades as often as the 25% profit target approaches, which results in less commissions and higher expectancy over time.
Implied Volatility & Performance: 16-Delta Short Options & 5-Delta Long Options
When filtering for VIX levels at trade entry, the trades with the highest commission-adjusted P/L expectancy were the loss-management and high profit target combinations with high VIX entries:
Iron Condor Variation #2: 30-Delta Short Options & 16-Delta Long Options
Unlike the 16-delta iron condors, the 30-delta iron condors saw the highest commission-adjusted P/L in the 25-50% profit target approaches. Since the short options are much closer to the stock price, the trades need to be held for much longer to achieve the 75-100% profit levels. Historically, waiting for these profit levels has not been favorable (without filtering for IV at entries).
Implied Volatility & Performance: 30-Delta Short Options & 16-Delta Long Options
After filtering for VIX levels at the entries of all trades, we found that the 30-delta iron condors have historically performed the best when entered in high VIX environments:
No matter the management combination, entering these tighter iron condor trades in high volatility environments has resulted in the most efficient trades in terms of commission- and time-adjusted P/L.
Hopefully, this in-depth study can help guide you towards more informed trading decisions when trading iron condors in equity indices.
Thank you for reading!
