?> September 2021 - projectfinance

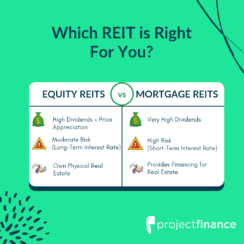
Equity REITs vs Mortgage REITs + 13 Best Stocks

Equity REITs vs Mortgage REITs

REITs for Beginners

Real estate investment trusts (REITs) offer investors a great way to diversify their equity holdings. In the past, investing in real estate was a time-consuming and cumbersome process. Today, with the introduction of exchange-traded REITs, investing in real estate is only a few clicks of your mouse away.

According to the Internal Revenue Code (IRC), a business must meet the below criteria in order to qualify as a REIT:

  • Receive at least 75% of gross income from real estate. This includes real property rents, interest on mortgages financing the real estate property or from sales of real estate property
  • Invest at least 75% of total assets in real estate or cash
  • Have at least 100 shareholders at the termination of the trust’s first year
  • No more than 50% of its equity shares are held by five or fewer investors

If an investment company does indeed meet the above criteria, that business will be considered a REIT. They are therefore considered a “pass-through” business, which has added tax benefits. 

Though owning real estate outright may be more tax advantageous than investing in REITs, REITs do come with their own tax advantages when compared to traditional equity investing. Let’s explore the tax implication of a “pass-through” business next. (Taxation can be fun when you learn about NOT paying taxes!)

Pass-Through Companies

Pass-through businesses (which qualified REITs are) pay ZERO corporate tax on their profits.

For example, let’s say that you are invested in JNJ stock. Before JNJ pays you a dividend, JNJ must pay corporate taxes on these proceeds. With REITs, however, the proceeds are passed on without JNJ ever paying this tax (which is currently 21%). This means more money for you!

So that’s taxation on the corporate level; what about on the individual level?

REITs Advantage for Individual Tax Rate

Investors in REITs can also save money on the individual tax level. So long as the business qualifies as a REIT, investors can take advantage of a 20% rate reduction to individual tax rates on the ordinary income portion of these distributions.

Now that we understand a little more about REITs, let’s take a look at a few of their advantages when compared to traditional real estate investments.

REITs Advantages Over Traditional Real Estate

Traditional real estate management requires extensive hands-on maintenance. With REITs, you’ll never have to worry about repairing the roof or unclogging a toilet!

Perhaps the most awkward and tedious job of the landlord is collecting rent. With REITs, you never have to worry about chasing down tenants, nor do you need to worry about eviction scenarios should you have tenants who can’t make the payments.

The process of buying and selling real estate introduces great inefficiencies. You never know the exact price you can purchase property for, nor will you know for sure what you can sell that property for. With REITs, all you have to do is click “sell” and your position is liquidated at the current market price.

Many real estate investors take on loans or mortgages to purchase their properties. Rent payment is often used to pay off debt. In a scenario where you can either not rent the property, or your tenant can not pay the rent, you may be at risk of defaulting on your loan. This may result in a poor credit score that could tarnish your future plans.

If an individual owns investment property across numerous states, tax time can be a nuisance. With REITs, however, you do not have to file income taxes for every state. This can save a lot of time and money, not to mention headaches!

So now that we know a little bit more about REITs, let’s explore the two different types of REITs; Equity REITs (eREITs) and Mortgage REITs (mREITs). Additionally, we will do an overview of “blended” REITs, which, you guessed it, offer a combination of the two. 

With Equity REITs being the more popular option, let’s take a look at them first.

What are Equity REITs?

Photo by Quang Nguyen Vinh from Pexels

Equity REITs (eREITs) – reits.com – are indirect investment vehicles that invest in tangible real estate. They make their money from rental income derived from a pool of real estate investments. 

This income is passed on to investors through dividends (the tax advantages of which we touched on earlier). Additionally, equity REITs allow for share price appreciation. When the value of an eREITs holdings rises, so does the value of your stock position. This is in addition to your monthly dividends.

So what exactly do eREITs invest in? Pretty much anything. Here are a few of the more popular categories.

Why to Invest in Equity REITs

Equity REITs offer investors many advantages. Let’s look at a few of them now.

Rental income is one of the most reliable sources of income. It doesn’t matter what market cycle we are in, when the rent comes due we (must of us anyway!) must pay.

Real estate can be a shady business. I just moved into a high-rise that I recently discovered is going to require brand new copper pipes in the near future. With REITs, you don’t have to worry about the nitty-gritty of property. Investing on the corporate level allows for great transparency.

In addition to having comparable returns when compared to stocks, equity REITs have less exposure to volatility, allowing investors more peace of mind.

Over time, equity REITs can appreciate in price quite a bit. Some have even beat the stock market. This isn’t the case with Mortgage REITs (which we will get to soon!).

Most equity REITs trade on exchanges, making the process of entering and exiting positions very seamless.

Equity REIT Risks

No investment comes without risks. Though the risk that comes with investing in equity REITs is relatively low, there are indeed some risks.

Sometimes the housing market finds itself in a bubble, and just as many times, that bubble bursts. When the value of real estate falls dramatically, the value of equity REITs will fall with them. Therefore, it may be wise to avoid investing in equity REITs when housing markets are teetering near all-time-highs, as they are presently in 2021.

In order to purchase properties, equity REITs must borrow money. These loans are subject to long-term interest rate risk. When interest rates rise, so do yields. The higher the yield, the lower the value of the REIT. You can look at the 10 or 20-year treasury as a good benchmark for equity REIT interest rate risk.

Before investing in an equity REIT, it is important to understand the properties that that particular REIT invests in. There are over 1,000 REITs. Some of these have very narrow scopes. For example, if you were invested only in timberland REITs, you may experience higher volatility due to the narrowness of the fund.

Now that we know what eREITs are, let’s explore a few promising equity REITs!

Best Equity REITs

Ticker Company Dividend Yield Sector
AMT
American Tower
1.73%
Communications
UMH
UMH Properties, Inc
3.12%
Home Communities
Stag Industrial Inc
3.49%
Warehouses
HTA
Healthcare Trust of America, Inc.
4.27%
Medical Office Buildings
DEA
Easterly Government Properties Inc
5.02%
Government Facilities

What are Diversified Equity REITs?

Equity REITs can either invest in a single sector or diversify their holding across numerous sectors. Diversified REITs (reit.com) own and maintain two or more of the property sectors we listed earlier.

Generally speaking, the more diversified your portfolio is, the better. The most successful property investors have holdings across numerous sectors. If you can diversify in the REIT space for no additional cost, why not?

Here are a few of the more popular diversified eREITs.

Best Diversified Equity REITs

Ticker Company Dividend Yield Sector
Digitalbridge Group Inc
6.74%
Digital Infrastructure and Real eEtate
PW
Power REIT
No-Dividend
Greenhouses, Solar Farm Land and Transportation
OLP
One Liberty Properties, Inc
5.69%
Industrial, Retail and More

What are Mortgage REITs?

Faucet Dripping Coins
Image by mohamed Hassan from Pixabay

Mortgage REITs (mREITS) – reit.com  are unlike equity REITS in that these funds do not actually own the property. Mortgage REITs make money by providing financing for both commercial and residential properties.

They accomplish this by both investing in and owning mortgages. They rely on short-term financing to do this, and in turn loan this money out at higher rates. The difference, or “spread”, is passed onto the shareholder in the form of dividends. 

Why Invest in Mortgage REITs?

Since mREITS don’t invest in tangible real estate, the price of these funds is not at the mercy of the housing market. Of course, there are risks, just no direct risks pertaining to housing cycles.

mREITs usually pay higher dividends than equity REITs. Income thirsty investors not seeking capital appreciation may be attracted to mREITs for this reason.

The loans which constitute many mREITs are backed by agencies. Because of this, default risk can be minimalized.

Like equity REITs, most mortgage REITs trade on exchanges, thus making the process of entering and exiting positions very seamless.

Mortgage REIT Risks

Mortgage REITs are inherently more risky than equity REITs. This is mainly because of the high-risk nature that comes with short-term lending. Let’s next explore this specific risk, as well as a few other mREITs risks. 

Just like Equity REIT, Mortgage REITs have interest rate risk, but of a different kind. Mortgage REITs typically loan money for their businesses at short-term interest rates (remember, equity REITs borrow at the long-term interest rates).

Mortgage REITs make money from mortgage payments. As long as the interest rate on these long-term mortgages is higher than the short-term rate they borrow at, they will make the difference in profit and pass that on to you, the shareholder. 

But what happens when short-term interest rates spike higher? The spread narrows and the income of mortgage REITs go down, thus resulting in a lower dividend for you. 

However, most mREITs hedge against this risk using financial instruments such as options contracts.

The dividends of equity REITs are derived from a steady stream of rent income. The dividends of mortgage REITs are subject to short-term interest rates, which are volatile and in constant flux. This results in less reliable dividend payments.

Mortgage REITs make money from mortgage payments. As long as the interest rate on these long-term mortgages is higher than the short-term rate they borrow at, they will make the difference in profit and pass that on to you, the shareholder. 

But what happens when short-term interest rates spike higher? The spread narrows and the income of mortgage REITs go down, thus resulting in a lower dividend for you. 

However, most mREITs hedge against this risk using financial instruments such as options contracts.

In order to fund new investments, mortgage REITs are known to issue new stock. When new stock is issued, the value of pre-existing shares goes down in value. And who wants the value of their stock to go down!

Let’s now take a look at a few of the more popular mortgage REITs.

Best Mortgage REITs

Ticker Company Dividend Yield Sector
NLY
Annaly Capital Management, Inc.
9.93%
Very Diversified
NRZ
New Residential Investment Corp
8.90%
Very Diversified
PMT
PennyMac Mortgage Investment Trust
9.36%
Home Loan Lender
CIM
Chimera Investment Corporation
8.55%
Residential Mortgage Loans
AGNC Investment Corp
8.85%
Agency Backed MBS (Mortgage-Backed Securities)

Equity REITs v Mortgage REITs

In a nutshell, mREITs tend to be more risky than eREITs. This is mainly due to mREITs exposure to short-term interest rate risk.

The below table highlights some of the main differences between eREITs and mREITs

Equity REITs Mortgage REITs

Interest Rate Risk

Moderate: Long-Term Rate Risk

High: Short-Term Rate Risk

Business Revenue

Rental Income on Commercial Real Estate Property

Loaning Money in Commercial and Residential Properties

Shareholder Value

Price Appreciation and Income

Income

Share Dilution Risk

Low

High

Dividend Yield

High

Very High

Overall Risk

Moderate

Moderate to High

What are Hybrid REITs?

If you’re interested in investing in both equity REITSs and mortgage REITs, hybrid REITs allow you to do this by investing in a single fund. 

Hybrid REITs combine the strategies of equity and mortgage REITs. These funds both buy properties and finance real estate. They offer the benefit of both categories while simultaneously reducing risk in the form of diversification.  

Transcontinental Realty Investors (TCI) and Simon Property Group Inc (SPG) are two popular hybrid REITs.

Final Word

REITs offer diversification seeking investors a great opportunity to expand their portfolio. It is important to remark that not all REITs are created equally. 2020-2021 proved that. Retail, hotel and office REITs plummeted on the tail of Covid-19. A few did not survive. 

Having a general pulse of the real estate market is crucial before investing in a REIT fund. Make sure to always check the historical share and dividend performance before investing. Although past results are not indicative of future performance, this is a great starting point.

Recomended Reading

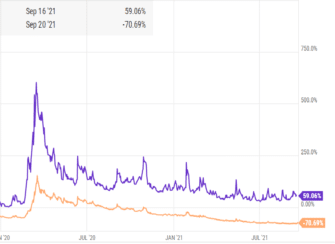
5 Way VXX Options Differs from VIX Options

VXX vs VIX 3 Year Chart
VXX vs VIX 3 Year Chart (powered by ycharts)

In 2022, volatility products have been exploding in popularity. There are two catalysts behind this drive:

However, getting started with trading volatility can be a daunting process. There are numerous ETFs out there that track volatility, all in their own unique way.

Two of the most popular volatility products are the exchange-traded note (ETN) VXX (iPath® Series B S&P 500® VIX Short-Term Futures) and the VIX Index (CBOE Volatility Index).

The first thing to understand is that these two products have very different investment strategies; they should not be used interchangeably. While both track volatility indexes, there are some huge differences between them.

In this article, projectfinance will go over the main differences between these two products. Additionally, we’ll explain the benefits of volatility products as well as the similarities that both VIX and VXX share. Let’s get started with our comparison chart below!

VIX vs VXX

VIX VXX

Settlement Method

Cash Settled

Physical Delivery (Stock Settled)

Style

European

American

Underlying

S&P 500 options

VIX Short-Term Futures

Profound Time Decay 

No

Yes

Let’s start off by looking at the definition of these two products, as well as their respective histories.

VIX Definition and History

VIX Definition: The “VIX”, also known as the “Fear Index”, is the ticker symbol for the Chicago Board Options Exchange’s CBOE Volatility Index. This index measures the market’s expectations for volatility over the proceeding 30 days based on near-term S&P 500 index options.

VIX does not offer stock, but it does offer futures and options trading.

VIX History: The VIX is the oldest and most popular volatility product. The VIX was conceived in 1990. Futures on the VIX began trading in 2004; options on the VIX were first offered in 2006.

VXX Definition and History

VXX Definition: The iPath® S&P 500 VIX Short-Term Futures (VXX) is an exchange-traded note offered by Barclays PLC. Unlike ETFs, ETNs are “fixed income” securities and therefore must track the performance of their representative index; there is no tracking error. However, it is a futures-based ETF, which carries significant risks.

This volatility “ETN” tracks the short-term futures of the VIX with 30 days to expiration. However, there is no futures contract on the VIX that is always 30 days to expiration; the dates constantly change. To remedy this, Barclays utilizes two futures contracts (front-month and the proceeding month), and constantly adjusts the respective position sizes so the net days-to-expiration is 30 days.

Unlike VIX, VXX does have underlying stock which you can trade.

VXX History: Barclays VXX first began trading in 2009. This particular “series” shut down in 2019. Later, another version of VXX was launched by Barclays, called VXX series B, which trades under the old ticker of VXX.

VXX vs VIX Fundamental Difference

Before we get started, let’s first examine the roots of our two products.

The key to understanding the difference between these two products lies in their composition: the VIX is formed with S&P 500 options; VXX is formed with VIX futures. Therefore, you can think of VXX as a sort of “derivative of a derivative”, not to get too “Inception” on you!

3 Reasons to Trade (or Monitor) Volatility

Before we get into the differences between VXX and VIX, it may be helpful to first understand the reasons behind their popularity. Unlike stocks, volatility does not appreciate in value over the years, nor do volatility products pay dividends. So why do investors trade volatility products? 

1. Volatility as a Market Hedge

Volatility products were created as a way for traders to mitigate risk. How?

Let’s say that you own 100k worth of stock in the SPY ETF. You are a senior investor and worry that the unemployment number coming out tomorrow may have an adverse effect on your portfolio. However, (perhaps because of tax reasons) you don’t want to sell any of your stock. Instead, you could purchase an equivalent amount of call options in the VIX. That way, if the “fear index” skyrockets, the appreciation of your VIX calls will help offset any losses on your stock.

2. Trading Volatility (VXX and VIX) for Stock Market Speculation

Though volatility products offer investors a great way to hedge, most contracts traded in VXX and VIX (particularly VXX) are the result of traders speculating on market direction. Professional traders love to “sell volatility”. When volatility is sold, traders profit when the index (VIX) or ETN (VXX) either stays the same or goes down in value. This is typically what happens in normal markets, thereby it is a consistent way to generate income.  

However (and a big however), this strategy certainly isn’t the only one; one trader nicknamed “50 cent” on the CBOE loved buying out-of-the-money calls on the VIX. He executed this strategy for one year, slowly accumulating painstaking losses.

And then, one week, following a steep market sell-off, 50 cent racked in a $200m profit!

Selling volatility usually makes money, but if you’re not hedged and the market goes south fast, watch out! 50 cent is waiting for you. 

50 Cent's VIX Long Call P-L

3. Volatility Index’s Provide Value for Everyone

You don’t have to trade volatility products in order to take advantage of their utility. The VIX index is a great indicator of market uncertainty. If you’re the owner of a portfolio of stocks and wish to get a window into the future predicated moves of the market, the VIX is a great tool. It is the most reliable index for stock market volatility in the world. 

Similarities of VIX and VXX

Before we get into how VXX and VIX differ, let’s explore some of the similarities of the two. After all, VXX and VIX are more alike in nature than they are different. Here are three similarities:

  1. Both VXX and VIX rise in value during steep market declines. 
  2. In the short-term, price movement tends to be relatively synchronized between the two (but not always!). Take a look at the graph below. (Later we will look at a 3-year graph comparing the two).

3. Implied Volatility (IV) on Volatility Products

The “IV” of traditional indexes and equities tend to go down with further out-of-the-money strike prices. Volatility products, however, act just the opposite: the implied volatility on VXX and VIX both rise with higher strike prices. Take a look at the below screenshots from the tastyworks platform comparing the IV on the VIX and SPX (which tracks the S&P 500).

VIX Implied Volatility Increasing
SPX Implied Volatility Decreasing for Options
SPX Implied Volatility Decreasing

5 Differences Between VIX and VXX

Let’s now explore the most important part of this article: the 5 difference’s between the two products!

1. VXX Price Decays Faster Than VIX

Though VXX and VIX have a lot in common, they are verily not the same products. We spoke earlier about the composition of the two products: VIX is composed of S&P 500 options; VXX is composed of futures contracts on the VIX. The result for VXX is a “synthetic” futures contract. This results in inefficiency. 

Take a look at the below chart, which compares VXX to VIX over a duration of three years.

VXX vs VIX 3 Year Chart
VXX vs VIX 3 Year Chart (powered by ycharts)

Over the course of 3 years, VIX rose 59% in value while VXX dropped over 70%. So why such a drastic difference in return?

Historically, VIX futures (which VXX comprise) are priced at a premium to the index, particularly futures that settle more than 30 days away (which VXX also encompasses). However, as expiration nears, that premium begins to decay. The resulting price action can result in futures on the VIX losing more in value than the respective index. 

Though this price differential isn’t a lot over the short-term typically, the above graph shows us just how devastating it could be to investors long VXX over time. 

2. VXX and VIX Are Made of Different Underlying's

The CBOE’s VIX index is constructed using the implied volatility on SPX options. These options are “front-month”, and represent the market’s expected move for the proceeding 30-days. 

Barclays VXX ETN is based on VIX short-term futures. Since there is never a constant future contract with 30 days until expiration, VXX uses a combination of the two front-month VIX futures in order to synthetically mirror a perennially 30-day future contract. 

3. VXX and VIX are Styled Differently

All options are either styled American or European.

European Style Options

VIX options are “European” style (Investopedia). This simply means that options traded on VIX do not allow for early assignment/exercise. However, this doesn’t mean you can’t exit a long position in VIX before expiration, you simply can’t exercise your contract before expiration. 

This is an added benefit for trader’s short options in VIX; since early exercising is not allowed, you will never have to worry about being assigned before expiration!

American Style Options

VXX options are “American” Style (Investopedia). This means that the owner of a VXX option (call or put) has the right to exercise their option contract at any time (though this rarely happens when extrinsic value is on the table). 

We mentioned earlier that VIX has no tradable stock. Therefore, what do you actually deliver if you choose to exercise your option or are assigned at expiration?

That brings us to our next difference:

4. VIX is Cash-Settled; VXX is Physical-Delivery

Most European-style options are cash-settled. Most American-style options require physical delivery upon settlement. This stays true for VIX and VXX.

Cash Settled Options Definition (VIX): A settlement method used in options trading that does not require delivery of the underlying shares. Instead, a simple transfer of cash takes place which corresponds to the closing intrinsic value of the options. 

Therefore, VIX options are settled via an exchange of cash. 

Physical Delivery Options Definition (VXX): A settlement method in options trading that does require delivery of the underlying shares is “physical delivery”. When options are assigned and exercised under this method, shares of stock (typically 100 shares per options contract) are exchanged.

Long/short call options under this method will buy/sell shares (respectively) of the stock at the strike price of the option. Long/short put positions will sell/buy shares of the stock at the strike price of the option.

Unlike VIX, Barclays VXX product does indeed offer stock. Underlying’s that offer stock are settled in stock. All option contracts in VXX are settled via physical delivery of the underlying ETN.

5. VXX Allows for the “Contango” and “Backwardation” Trade

Though VXX’s strategy to use two months of future contracts creates some inefficiency, it also offers traders some benefits, such as the “contango” and “backwardation” trade – CME.

Backwardation Definition: Backwardation occurs when the price of a futures contract is trading at a discount to the expected spot price at expiration.

Contango: Contango occurs when the price of a futures contract is trading at a premium to the expected stock price at expiration.

In times of market distress, such as during the early days of the pandemic, the short-term forecast for a market is more uncertain than the long-term forecast. This leads to backwardation. 

Conversely, in a confident market, contango is often the resulting effect on future prices. 

Traders in VXX can take advantage of these two market events by participating in “arbitrage”. This is a very complex process and requires much research.

Final Word

At first glance, VXX and VIX may seem to be very similar in nature. However, after putting the two products under the microscope, we can see there are some major differences between the two.

Retail traders love VXX. Let’s end by taking a look at a few of the advantages of VXX.

Related Videos

VIX Explained

VXX Explained

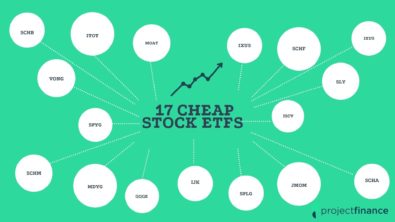
17 Best Low-Priced Stock ETFs for Beginners with Little Money

 Highlights

  • Most popular ETFs are priced at several hundreds of dollars; there are many low-cost funds that offer the same tracking for a greatly reduced price.

  • Many ETFs can be divided into large-cap, mid-cap, and small-cap. Generally speaking, the better capitalized a company is, the less risk they have (and reward).

  • It is important to note that “growth” ETFs generally have much more market risk than “value” ETFs or “blended” ETFs, which contain a combination of the two. 

2022 is becoming  the year of the exchange-traded fund (ETF). And it’s about time. ETFs offer investors perhaps the cheapest and best way to diversify their portfolios. Some broad-based ETFs (like Vanguard’s VTI) offers investors exposure to thousands of stocks. And all you have to do is buy one share!

However, many ETFs are not cheap. US stocks (equities) have been exploding in value lately. If you were to purchase every single stock within the S&P 500 on your own today, it would cost you $89,157,36.

I don’t know about you, but I don’t have that kind of money laying around. Even if I did, I don’t know if I’d want to spend the time not only entering the positions but constantly adjusting them to mirror the always-changing index!

This is where ETFs come in handy.

ETF (Exchange-traded fund) Definition: A security that trades on a stock exchange that tracks a particular set of pooled securities (like an index or a sector).

So instead of purchasing all of the 500 stocks in the S&P index, we could purchase an ETF that mirrors the index.

So how much would buying one share of an ETF representing the S&P 500 cost us? Below, I have listed the three most popular ETFs that track this index, along with their current market price.

SPY: SPDR S&P 500 ETF Trust  $447.88

IVV: iShares Core S&P 500 ETF  $449.90

VOO: Vanguard S&P 500 ETF  $411.82

Affordable ETFs

So $400+ is still a lot cheaper than $89,157, but this article is about the best CHEAP ETFs, and $400 isn’t cheap to me! There are indeed cheaper options.

But are we giving anything up by going after some of the lower-priced ETFs? No! Many ETFs simply track indexes. As long as they do this accurately and for a reasonable fee (expense ratio) the price of the ETF shouldn’t matter. All but two ETFs on our list have insanely low fees of at or under 0.15%.

In addition to being more affordable to beginner investors, low-priced ETFs are also attractive to option traders who utilize the covered call strategy. In this strategy, you buy 100 shares of stock and sell (write) one call against this stock. When an ETF is trading over $400/share, you’ll need 40k+ just to do a one lot. 

If you’re interested in learning more about options trading, please feel free to check out our video (or article), Options Trading for Beginners – 11m plus views, and counting!

Additionally, if you’d like to do a deep dive into the mechanics of how ETFs work, we have content on that as well. You can find both the article and the video below. 

Market Cap Explained

Outside of the US, we have listed a few broad-based international ETFs. Within the US, our list spans across different “market caps” (capitalizations -Fidelity)

Market Cap (Capitalization) Definition: The total value of a company that is traded on the stock market. A company’s “market cap” is calculated by multiplying the total number of shares by the current share price.

So essentially, the market cap tells us the approximate net worth of a company. If you wanted to buy that company, that company’s cap is in the ballpark of what you would be paying. But since we’re talking about the cheapest ETFs out there today, we probably aren’t funded well enough to buy Apple. 

A publicly traded company will always fall under one of three different market caps. We have listed top performers on our list from each of the below categories:

Companies with a relatively small capitalization of under $2 billion.

Companies with market caps that range between companies $2 and $10 billion in value.  

Companies with market caps that exceed $10 billion in value.

Additionally, we have listed a few “broad-based” ETFs. These funds span across all market sectors and generally include the most companies within their baskets. If you are only going to buy one ETF and want a lot of diversification, broad-based (or “total market”) ETFs are the way to go!

Without further ado, let’s get to the list!

Broad-Based ETFs

Ticker Fund Name Market Price Expense Ratio
Schwab U.S. Broad Market ETF
$108.16
0.03%
iShares Core S&P Total US Stock Market ETF
$102.49
0.03%
Morningstar® Wide Moat Focus Index
$103.32
0.45%

Large-Cap ETFs

Ticker Fund Name Market Price Expense Ratio
SPDR® Portfolio S&P 500® ETF
$52.64
0.03%
JP Morgan US Momentum Factor Index
$45.85
0.12%
Vanguard Russell 1000 Growth Index Fund ETF
$74.35
0.08%
SPDR® Portfolio S&P 500 Growth ETF
$67.63
0.04%
NASDAQ-100 Equal Weighted ETF
$86.85
0.35%

Mid-Cap ETFs

Ticker Fund Name Market Price Expense Ratio
Schwab US Mid-Cap ETF
$79.08
0.04%
SPDR® S&P 400 Mid Cap Growth ETF
$78.43
0.15%
IJK
iShares S&P Mid-Cap 400 Growth ETF
$81.83
0.17%

Small-Cap ETFs

Ticker Fund Name Market Price Expense Ratio
SLY
SPDR® S&P 600 Small Cap ETF
$94.98
0.15%
iShares Morningstar Small Cap Value ETF
$57.22
0.06%
Schwab U.S. Small-Cap ETF
$101.67
0.04%

Broad-Based International ETFs

Ticker Fund Name Market Price Expense Ratio
Vanguard Total International Stock ETF
$66.37
0.08%
Schwab International Equity ETF
$40.25
0.06%
iShares Core MSCI Total International Stock ETF
$73.47
0.09%

Growth vs Value Companies

In the above list, most of the ETFs employ the “blend” approach to investing in companies. This means the ETFs have within them both “growth” and “value” companies. 

However, you may have noticed a few funds on the list are “growth” exclusively. Growth stocks are typically younger and more exciting companies, and tend to get the most attention in the ETF space. Think Zoom and NVIDIA here. 

Opposite growth companies are “value” companies, which are well established, typically dividend issuing companies that are less volatile. Value companies have been around for a long time. A couple value companies are Johnson & Johnson and Campbell soup.

Growth Companies

  • Issues Small or No Dividends
  • High Beta = High Risk
  • Overvalued in Price
  • Earnings to Growth Ratio > 1

Value Companies

  • Typically Issues Larger Dividends
  • Low Beta = Low Risk
  • Undervalued in Price
  • Earnings to Growth Ratio < 1

Historically, growth stocks tend to outperform value stocks. This should make sense – since the US stock market has been historically bullish over the long run, more “risk-on” stocks, such as those that fall under the growth umbrella, should appreciate more in value than less risky securities. 

Take a look at the below chart, which compares the total returns (meaning dividends are included) between growth stocks (orange) and value stocks (blue) over the past decade.

We can see in the last few years, on the tail of Covid and stay-at-home policies, growth companies really soared.

Traditionally, growth stocks rise higher in bull markets, and sink lower in bear markets when compared to value stocks. This pattern, however, may not hold true forever in the modern world. 

Final Word

There are thousands of ETFs currently listed. Though projectfinance has picked through some of the top performers with the lowest fees, they may not be suitable for you.

Remember, there is more to an ETF than its performance. Before investing in an ETF on your own, make sure to follow the below checklist:

I have seen ETF expense-ratios higher than 5%. This means your investment has to make 5% on the year just to breakeven! Make sure to take the time to check this ratio before investing.

Issuers of ETFs have a fund information page, sometimes called a prospectus, that compares their fund with that of the representative index. For index-tracking funds, you ideally want a fund that closely matches the performance of the benchmark index.

The ease to enter and exit positions at a minimal cost is ideal. This is known as liquidity. This means high volume and tight bid-ask spread. The funds we listed are all very liquid.

However, not all ETFs are created equally. Years ago, I invested in an emerging market ETF to discover later the bid was $52 and the offer was $55. I could have lost up to 6% of my investment from simply entering and exiting a position! Make sure the spread between the bid and ask is tight, and the daily volume is high (preferably over 1 millions shares).

Recommended Reading

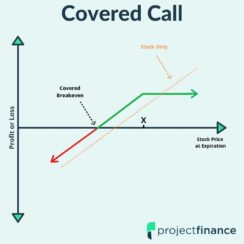
7 Covered Call ETFs and How They Work

7 Best Covered Call ETFs and How They Work

Covered Call P&L Graph

The covered call strategy is a great way for risk-averse investors to make passive income in a sideways market. 

For those who already have a solid understanding of how covered calls work, we have provided a list of some of the best covered call ETFs below. 

For those who aren’t 100% certain about the mechanics of covered calls (each one is different!), please read on as understanding these various strategies is vital to understanding their performance. 

Lastly, I would like to add that most covered call ETFs are NOT passive investments. The “set-it-and-forget-it” approach does not work here. Why?

Over time, covered call ETFs tend to massively underperform the market. If you are looking at a long time horizon (such as retirement), history tells us the best approach to investing in equities is outright. However, if your time horizon is relatively short, and you are either neutral or slightly bearish on the market, covered calls may provide a great way for you to make some extra money. 

Without further ado, here’s our list! Remember, there is A LOT more to these ETFs than their dividend! A fat dividend usually coincides with forfeiture of price appreciation. 

Please read on if you have any questions as they will most likely be answered.

7 Top Covered Call ETFs

Ticker Fund Name Dividend Yield Strategy Option Strategy Expense Ratio
Global X S&P 500 Covered Call ETF
9.12%
Income
Sells at-the-money calls
0.60%
Global X Nasdaq 100 Covered Call ETF
9.92%
Income
Sells at-the-money calls
0.60%
Global X Russell 2000 Covered Call ETF
12.09%
Income
Sells at-the-money calls
0.60%
Global X S&P 500 Covered Call & Growth ETF
0.78% 30-day SEC Yield (new fund)
Income + Price Appreciation
Sells at-the-money calls on 50% of portfolio
0.60%
Global X Nasdaq 100 Covered Call & Growth ETF
0.08% 30-day SEC Yield (new fund)
Income + Price Appreciation
Sells at-the-money calls on 50% of portfolio
0.60%
X-Links™ Gold Shares Covered Call ETN
9.77%
Income + Price Appreciation
Sells out-of-the-money calls
0.65%
KNG
FT Cboe Vest S&P 500® Dividend Aristocrats Target Income ETF
3.40%
Income + Price Appreciation
Sells at-the-money calls on 20% of portfolio
0.75%

Want to skip over the covered calls tutorial and jump directly to an explanation of the above ETFs? Click Here!

Understanding Covered Calls for Beginners

The covered call option strategy is defined as the following:

Covered Call: A financial transaction where a call option is sold against an underlying security, typically 100 shares of stock.

Components:

  • Long 100 Shares of Stock
  • Short 1 Call Option

For a complete lesson on covered calls, please make sure to check out either our video or article on the subject. 

Covered Call Example

In order to understand the utility of covered calls, let’s take a look at a quick example.

Let’s say you own 100 shares of Invesco’s QQQ ETF, which represents the Nasdaq 100. 

In this scenario, let’s assume QQQ has been reaching all-time highs every day. You think the ETF is in for a breather and will trade sideways for some time. The current price of QQQ is $375/share. 

With stock, there is no way you can capitalize off of your projected market direction. However, if you utilize options, you can make a little extra money off of a neutral share price. How?

By selling a call. Let’s say that you do not believe QQQ is going to trade above $380/share for the next month. In this situation, you could sell a call option 30 days out at the 380 strike price. We’ll say you are able to sell it for $2. 

What does that mean? As long as QQQ is trading below $380/share when your option expires, you’ll receive the full credit of $2, or $200. However, if the ETF rallies to, let’s say, $390/share, you will miss out on this price appreciation. 

When you sell a call against your stock, the most you can ever make is strike price + premium sold. In our case, once the stock goes above (380+2) $382/share, we won’t see any additional gain. For every dollar we make on the stock at these levels, we lose a dollar on the option. 

Covered Call "Moneyness"

Covered calls can either be sold out-of-the-money, at-the-money, or in-the-money. In our above examples, all covered calls are sold at-the-money, or out-of-the-money (the traditional covered approach). 

The “moneyness” of an option is determined by the strike price of that option relative to the stock price. 

Here’s how that looks on a chart:

Option Moneyness

Covered Call Performance

Markets will always be in one of three states: bearish, neutral, or bullish. The covered call strategy will profit in 2 (and sometimes 3!) of these markets.

1. Covered Call in a Bullish Market

Covered calls typically do not fare too well in a bullish market. This depends, of course, on the strike price of the call sold! If you sell an at-the-money option, you will likely miss out on price appreciation if the underlying rallies. If you sell an out-of-the-money option, and the stock doesn’t reach the strike price of the call you sold, you will win on both the income received as well as price appreciation!

2. Covered Call in a Neutral Market

Covered calls love neutral markets. In this scenario, you won’t miss out on any price appreciation. While everybody else is flat, you’ll be making a nice dividend!

3. Covered Call in a Bearish Market

Like covered calls in a bullish market, what really dictates how well a covered performs in a bear market depends on how bearish that market is.

For a minorly bearish market, the call we sell provides us some downside protection. Just subtract the premium you received from the stock price, and that’s where your losses begin to build up.

In a market correction, however, watch out! Though covered calls mitigate risk, they by no means irradicate risk; you still have A LOT of downside risk!

Let’s next look at a few pros and cons of covered call exchange-traded funds (ETFs).

Covered Call ETF Pros

1.) Income Generation

Selling a call option against your long stock creates a steady stream of income for your portfolio. Generally, covered call ETFs pay out dividends on a monthly basis, as that is the frequency that they sell calls.

The further out of the money the call you sell is, the less premium you will receive. Some covered call ETFs, like QYLD, sell at-the-money calls. That is the reason their dividend is so high. But remember, the closer the strike price is to the stock price, the less you’ll make when the stock rallies.

2.) Profit in a sideways market

With markets teetering near all-time highs, many investors believe we are in for a breather. The covered call strategy allows you to capitalize in a neutral market. If the market goes nowhere, you will collect the full premium on the call you sold.

3.) Covered Call ETFs may save time and money

Trading options is a very complex and time-consuming process. After working as an options broker in Chicago for 15 years, I can tell you that the education never stops. Investing in covered call ETFs gives you peace of mind; you don’t have to worry about “rolling” positions, nor do you have to worry about whether or not you are assigned.

ETFs employ “price stabilizers” to keep the ETF price in check, as well as fund managers to actively manage the positions. This does, however, come at a fee – most covered call ETFs I have seen charge a fee of about 0.60%. Though high when compared to other ETFs (the popular SPY ETF fee is only 0.09%), these funds certainly earn their money. Remember, trading options can be a costly endeavor in terms of time and commissions.

4.) Covered Call ETFs allow for great diversification

A lot of the funds on our list go out and actually buy all of the securities within the index. That’s a lot of work! Can you imagine how much it would cost to buy all of the stocks within the Nasdaq 100 on your own?

5.) Covered Call ETFs have no assignment risk

When you are trading covered calls on your own, you are at risk of being assigned on your short call at times when the extrinsic value is low, or when the underlying issues a dividend (dividend risk). ETF managers take care of this for you, mostly by selling capitalize in a neutral market (European style options) which have no early-assignment risk as opposed to options on traditional stocks and ETFs (American style options).

Covered Call ETF Cons

1.) Upside limited to strike price + premium sold

Covered calls are not great investments for bullish markets. That is assuming an alternative for your investment strategy was to invest directly in the stock. After the stock surges beyond your strike price + premium sold, you will see no additional profit.

2.) Covered calls have massive stock risk

Though the covered call strategy does indeed limit the risk of an equity position, it by no means eradicates that risk. After you account for the discount of the premium you sold, a covered call loses money on a 1:1 basis with the stock. 

3.) Poor performance in volatile sectors

The more volatile the underlying, the higher the dividend you will receive. But trading covered calls in very volatile sectors, such as energy, can wipe your account out. How? 

Let’s say oil is trading at $100 a barrel and you own an ETF that matches this price, meaning the ETF tracks oil and is currently trading at $100/share. Let’s say oil plummets to $20/barrel. If you took in $5 for an at-the-money-call when the stock was at $100, your max loss would be $95/share. Your at-risk expose is still $95/share!

But that’s ok, because when oil rallies, you’ll be included in it, right? Nope. If you’re trading a covered call on oil, your upside IS LIMITED TO STRIKE PRICE PLUS PREMIUM. 

Take a look at how Credit Suisse X Links Crude Oil Shares Covered Call ETN USOI (blue line) compares to a non-covered oil ETF (orange line). Remember, this chart doesn’t account for USOI’s fat dividends, but if you wanted to be long oil, you would have surely missed out!

USOI vs DBO
Covered oil ETN (blue) vs non-covered oil ETF (orange) - Google Finance

XLYD, QYLD and RYLD ETFs Explained

The covered call ETF’s XLYD, QYLD, and RYLD (offered by Global X) all employ selling an at-the-money call representing 100% of their underlying portfolios. Respectively, they track the S&P 500, the Nasdaq 100, and the Russell 2000.

The closer your call is to being in-the-money, the more premium you will receive. It is because of this these three ETFs all have the highest dividends on our list. 

But remember! When you sell at-the-money calls, you don’t participate in much price appreciation. And following a market crash, it may take a very long time indeed for your share price to play catch up.

For example, all markets crashed when the pandemic hit, but the Nasdaq soared on the tail of Covid. When you sell a covered call, however, your upside is limited to the premium received. This means that the QYLD fund participated very little in Nasdaq’s rally, as illustrated in the below 3-year chart comparing QYLD (purple) to its benchmark, the Nasdaq, as represented by QQQ (orange line).

QYLD vs QQQ
QYLD vs QQQ - Source: ycharts

The above chart represents the downside to covered call ETFs. There is, however, a pretty great upside. In an environment where the stock is stagnating, you’ll still be making a nice fat dividend. These three ETFs pay between 9 and 12% annually!

XLYG and QYLG ETFs Explained

XLYG and QYLG are two relatively new funds offered by Global X. Their representative indexes are the S&P 500 and the Nasdaq 100, respectively. 

Similar to XLYD, QYLD, and RYLD, these funds sell one-month at-the-money calls on their indexes. However, there is one huge difference  – XLYG and QYLG only sell these calls on 50% of their stock.

What does that mean? It means the other half of the equity is free to run higher (and lower) with the stock.

Since we are only selling calls on half of our positions here, it makes sense that the dividends for these two ETFs are lower. 

GLDI ETF Explained

Gold Bar

The GLDI ETF (offered by Credit Suisse X-Links) implements a covered call investment strategy in gold through the GLD ETF, which tracks the price of gold. 

This fund offers investors who are neutral to minorly bearish in gold a great way to make a little extra income. I say minorly bullish because the fund sells calls that are 3% out-of-the-money on a monthly basis. This means the ETF can run 3% higher before we start missing out on price appreciation. 

What is attractive here is the high dividend yield of 9.77%. Most of our other funds receive this kind of yield from selling at-the-money calls. But remember, gold is a lot more volatile than the S&P 500! The premium here is justified by the volatility in the underlying. 

KNG ETF Explained

Last on our list is the KNG ETF, offered by First Trust. This fund tracks the S&P 500 Dividend Aristocrats Target Income Index.

Like XLYG and QYLG, this ETF is a hybrid fund. Here’s how First Trust describes its fund:

Perhaps most important is the low option exposure this ETF has: covered calls are written on a notional value of no more than 20% of the value of each underlying Aristocrat Stock.

This low covered call exposure is the reason for its relatively low dividend yield of 3.40%. This is a great ETF for minorly bullish investors on the S&P 500 Dividend Aristocrats Index. 

Final Word

So what do we take away from all of this? ETFs are a great way for novice and advanced traders alike to participate in the covered call strategy. There are downsides as well as upsides. It is not free money; you are giving up A LOT when you decide to invest in a covered call ETF. Having a solid grasp of how options work is a prerequisite.

Check out some of our recommended reading if you’d like to learn more about options trading!

What are your thoughts on covered call ETFs? Are they worth it? Let me know in the box at the bottom of this page!

Recommended Reading

The Vertical Spread Options Strategies: Beginner Basics

The Vertical Spread Options Strategies: Beginner Basics

Bear Call Spread Graph
Bear Put Spread
Bull Call Spread
put spread

Vertical Spread Definition: In options trading, a vertical spread is a strategy that involves both buying and selling options of the same type (call or put) and expiration cycle, but at different strike prices. 

There are dozens of different types of options trading strategies. Amongst the most popular of these are the vertical spread strategies. 

If you’re able to master the 4 vertical spread option strategies, tackling more advanced trades such as the “iron condor” will be a piece of cake. In fact, having a firm grasp on how these basic types of strategies work will allow you to understand 80% of all options strategies!

We will be teaching the 4 vertical spread strategies in this article through numerous visual examples as well as trade performance illustrations to fully demonstrate how these strategies respond to changes in stock price and the passage of time.

Prefer to watch the video rather than read the article? No problem! Check it out below. 

Article Prerequisites

If you’re brand new to options trading, this article isn’t the place to start. This video assumes you have a solid grasp upon how single options trade (long/short calls and puts) as well as slightly more advanced topics such as intrinsic and extrinsic value

This article is actually the second installment of an options education tutorial. The first segment of the course is “Options Trading for Beginners”.

Below, you will find the popular video version of the course (10 million+ views!), as well as the write-up version. 

Understanding the topics listed in the above material is crucial to understand what we will be talking about below.

For those that are ready to move on, let’s get started!

Highlights

  • A vertical spread is an options strategy that combines the purchase and sale of two options simultaneously.

  • Both options in a vertical spread must be of the same expiration and quantity.

  • Vertical spreads offer investors a great way to reduce both cost and risk as opposed to trading single options.

  • The bull call spread is a bullish options strategy constructed with call options consisting of the same expiration and quantity.

  • The bull put spread is a bullish options strategy constructed with put options consisting of the same expiration and quantity. 

  • The bear call spread is a bearish options strategy constructed with call options consisting of the same expiration and quantity.

  • The bear put spread is a bearish options strategy constructed with put options consisting of the same expiration and quantity.

What is a Vertical Spread?

Vertical Spread Definition: In finance, a vertical spread is an options strategy that combines the purchase and sale of two options simultaneously. 

So what options will we be buying and selling?

  1. Purchase (long) an option at one strike price
  2. Sell (short) an option at a different strike price

In order to be considered a vertical spread, both options in the spread must fall under the same type of option (call/put), meaning that they must both be calls or both be puts. You can’t have a vertical spread with one call and one put; that would make it a different kind of spread.

Additionally, both options must be of the same expiration date and quantity. If the options were of different expiration, the spread would be considered a “diagonal” spread; if the options were of mismatched quantities, the spread would be considered a “ratio” spread. 

Therefore, in order for a spread to be considered a vertical, the below criteria must be met:

  1. Both options are either calls or puts
  2. Both options expire on the same date
  3. The options are the same quantity 

Here’s how both a vertical call spread and put spread appear:

Call Spread Example: Buy the AAPL June 140 Call, Short the AAPL June 150 Call

Put Spread Example: Buy the NFLX July 525 Put, Short the NFLX July 500 Put

Setting up a Vertical Spread on Tastyworks

Let’s next take a look at how that would look in your trading software. The below screenshot (as all of our platform screenshots) is from tastyworks, our preferred broker.

Vertical Spread AAPL

So in the above example, you can see we selected the Oct16 140 call and the Oct16 150 call (highlighted in red and green). Notice how we chose the options “vertically” on the chain? One option is above the other. Additionally, both options are of the same expiration, class, and quantity. Therefore, this is the initial setup for a vertical spread

Many beginner options traders wonder why spread trading is even necessary; if we are bullish on a stock, why not just outright buy the call? Why bother with selling an additional call, thus reducing our maximum profit?

Read! 29 Core Options Trading Strategies

Why Trade a Vertical Spread? (Single Options vs. Spreads)

In order to fully understand the benefit of spread trading over single options trading, we need to return again to the tastyworks trading platform.

AAPL Options Chain
AAPL Options Chain

In the above options chain on, we have highlighted two options. The option in green is the AAPL July 120 Call. If we were to buy this option, it would cost us about $11.45. 

So let’s say we purchase that option. What is our max loss? Well, since the option can go to zero, our max loss is therefore the complete premium of $11.45.

Now let’s take a look at the option in red, which is located “vertically” down the options chain from the 120 call. Here we see the AAPL July 130 call. Remember, in order to create a spread you must buy one option and sell another option. Since we are buying the 120 call, we are selling the 130 call. 

We learned our max loss was $11.45 on the long call; but what would our max loss be if we sold a call against our long? Simply take the debit paid (11.45) and subtract the premium received from the short option (7.00) gives us a net debit paid of 4.45.

Therefore, selling the 130 call against the 120 call reduces our max loss down to $4.45 from $11.45! 

Vertical Spread Advantage

Many traders prefer vertical spreads when compared to outright buying options because vertical spreads:

  1. Reduce the trades loss potential
  2. Increase a trader’s probability of making money

Are you beginning to see why vertical spreads make sense?

Of course, there is a trade-off for this reduced risk, and that comes in reduced reward. The maximum profit on a long call is infinite; the maximum profit on a vertical spread is fixed. 

We will cover all of this more thoroughly later on. 

Next up, we are going to get to the core of vertical spreads by studying each one individually. 

The Bull Call Spread (Call Debit Spread)

Bull Call Spread

Bull Call Spread Definition: The bull call spread is a bullish options strategy constructed with call options consisting of the same expiration and quantity.

Spread Components:

  • Buy a call option at one strike price

  • Sell another call at a higher strike price

Aliases: 

  • Bull Call Spread
  • Buying a Call Spread
  • Call Debit Spread

How a Bull Call Spread Makes Money

In order to understand how a bull call spread profits, let’s take a look at an example. A visual of our trade is provided below, as well as our trade details.

Trade Details:

Stock price at entry = $142.28

Call spread construction = Buy the 135 call for $9.30, short the 150 call for $1.54. Both options are in the 46-day expiration cycle.

Spread Purchase Price = $7.76 ($776 capital requirement)

Let’s first focus on the two most important parts: the options themselves.

  • Long the 135 Call for $9.30

  • Short the 150 Call for $1.54

So we are paying 9.30 for a call, then selling another call for 1.54. If we were only to buy that call, the cost of the trade would be $930. But since we are selling a call against this long option (thus creating a call spread) the cost of our trade will be reduced by this credit received.

Bull Call Spread Cost of Trade

In order to get the true cost (and risk) of a debit spread, simply subtract the credit received from the debit paid. 

Debit paidPremium Received = Cost of Debit Spread

$9.30 – $1.54 = $7.76.

In our Options Trading for Beginners Tutorial, we explained how one option contract represents 100 shares. Therefore, in order to get our true cost of a trade, we must multiply the trade cost by 100, or simply move the decimal point two places to the right. 

A trade cost of $7.76 would therefore cost us $776. Additionally, this is the total amount of risk we have for this position. 

The most important concept to understand in options trading is risk. Let’s next take a look at the risk profile for bull call spreads by seeing how the spread reacts to changes in stock price and time.

Bull Call Spread Risk Graph.

Below, you will find the risk graph for our trade. 

Bull Call Spread Maximum Loss

Perhaps the most important component of this trade is its total risk. The risk on bull call spreads is limited to the debit paid. If you pay $7.76 for a call spread, you will only ever lose $776. Period!

This “max loss” scenario will occur if the stock is at or below $135 on expiration. This scenario is outlined on the bottom left portion of the above graph.

Bull Call Spread Breakeven

So we figured out how much this trade will cost us ($776) but at what point will that stock need to be trading in order for us to breakeven? The equation to determine breakeven for a bull call spread is:

Breakeven Stock Price = Purchased Call Option Strike Price + Total Premium Paid

So let’s just plug our data in here now.

135 (purchased call option strike price) + $7.76 (total premium paid) = $142.76 (breakeven stock price).

So we need the stock to be trading at $142.76 at expiration in order for us to breakeven. If the stock is trading above this price, we will realize a profit; if the stock is trading below this price at expiration, we will realize a loss. 

If you’re new to breakeven prices, please check out our video on this subject!

How to Get the BREAKEVEN PRICE for ANY Options Strategy

Bull Call Spread Max Profit

Lastly, we have by far the most interesting outcome: maximum profit. 

Can you determine the max profit on your own? Remember, we paid $7.76 for a spread that is 15 points wide (150 strike -135 strike =15).

The most you can make on a vertical spread is the width of the spread. Since this spread is 15 points wide (remembering the multiplier effect), the most we can make here is $1,500. This is illustrated in green in the upper right portion of our above risk graph. 

But that doesn’t take into consideration the debit we paid! In order to calculate our maximum profit, we must therefore subtract the debit we paid. So $15-$7.76 gives us a maximum potential profit of $7.24, or $724. 

If you’d like to understand how we reached this number better, read on. If you already understand it, skip ahead!

Why is a Vertical Spread's Max Value the Width of the Strikes?

The maximum potential value of any vertical spread is the distance between the strike prices. 

The 135/150 call has a strike width of $15, therefore this spread can only ever make $15 ($1,500 when accounting for the multiplier). Why is this?

If the stock price is at $155 at expiration:

  • The long 135 call will have $20 of intrinsic value ($155-$135)
  • The short 150 call will have $5 of intrinsic value ($155-$150)

At expiration, the options will only have intrinsic value. Extrinsic value doesn’t survive expiration!

So at expiration, we can sell the 135 call for $2,000, but we’ll have to buy back the 150 call for $500. 

Collect $2,000 – Pay $500 = Collect $1,500

That is the best-case scenario. Remember, we are indeed bullish on the stock, but if it rises too high, our short position will be ballast on our gains. If the stock is at $200 at expiration, we will still only ever make the width of the spread!

We talked earlier about the advantages of vertical spreads; now you see the downsides!

Bull Call Spread Net Profit

But will we realize $1,500 in profit? No! Remember, you paid $7.76 for the spread to begin with. Therefore, this debit must be subtracted from the width of the spread. 

15 – $7.67 = $7.24 ($724) in maximum profit.  

For all bull debit spreads, the formula for maximum profit is:

Bull Call Spread Maximum Profit = Difference between the strike prices (minus) the debit paid to put on the position.

So now that we have all the boring technical stuff out of the way, how did our call spread actually perform?

Bull Call Spread Trade Example (Real Data Visualization)

Take a moment to study the below graph.

On the top portion of this graph, you will see the changes in the stock price.

On the bottom portion of the graph, we are looking at the actual change in our spreads value over time. 

If the spread price declines from the price we pay for it, we’ll have an unrealized loss. That’s what happened initially. Fortunately, we can see that the stock price soared higher in the subsequent weeks leading to an increase in the call spread value.

At around 4 days to expiration, the spread price closed in on its maximum value of $15. 

Would this be a good time to close the spread? Sure! You can close a spread at any time. If you’re close to max profit, why take a risk with more time for the stock to move against you?

With about 2 days to expiration, we can see the stock did indeed move against us, cutting in substantially on our profits.

Call Spread Outcome: Calculating Profitability

At expiration, the stock price was $148.06. Remembering we have the 135/150 call spread on, can you guess our profitability? 

Again, instead of resorting to formulas, think intuitively about this. The most we can make (not counting our premium paid to enter the trade) is $15. This happens when the stock closes above $150 at expiration. 

But the stock closed below this level. Therefore, our $15 maximum profit is reduced by the amount the stock is under $150. In this case, it would be 1.94 (150-148.06). 

Now, simply subtract this amount from the 15 point spread (15-1.94), which gives us a profit of $13.06.

But how much did we pay for the spread? The premium is always considered. If you sell a car, don’t you factor in the purchase price to determine your profit/loss?

In this trade, our purchase price was $7.76. Now subtracting this from the profit of $13.06, gives us a net profit of $5.30, or $530.

When you purchase a bull call spread, you will achieve maximum profit when the stock price closes above the spread’s upper strike price. We just missed that price here.

Closing a Call Debit Spread

Options trading is not static. Prices are in constant flux with the market. You are able to exit an options position whenever the market is open. You don’t have to wait until the option expires to take action; you can in theory trade out of an options position a second after opening it. 

So how would we close our above call spread early? By selling it!

This is done quite simply by creating the opposite trade of the one you initiated. This can be done in one single transaction. You can always “leg” out of a spread, but that will leave you with more exposure during the time when only one leg is open. 

NOTE: Stop-loss orders on option(s) are not recommended as horrible fills commonly result 

Ok, let’s now move on to the next vertical spread strategy!

The Bull Put Spread (Put Credit Spread)

So know that we know what a bull call spread is, let’s move onto the bull put spread.

put spread

Bull Put Spread Definition: The bull put spread is a bullish options strategy constructed with put options consisting of the same expiration and quantity.

Spread Components:

  • Short a put option at one strike price

  • Buy another put option at a lower strike price

Aliases: 

  • Bull Put Spread
  • Shorting/selling a Put Spread
  • Put Credit Spread

This strategy is similar to our bull call spread in that they are both bullish on the market, meaning that if the market goes up, they both make money. However, that’s where the similarities end. There are three main differences between bull call spreads and bull put spreads:

  • Bull put spreads consist of all put options
  • The long option in the bull put spread is below the price of the short option
  • A net credit is the result of a bull put spread. (A bull call spread creates a debit)

Since we are selling this spread (as outlined in the third bullet above), a net credit is received. That is why this trade is called a credit spread. Whenever you receive a premium for a spread, it’s a credit spread; whenever you pay a debit, it’s a debit spread.

How a Bull Put Spread Makes Money

A bull put spread makes money when the stock rises in value, ideally above the strike price of the put sold. Take a minute to study the below image. 

Bull put spreads tend to have a high probability of success. In theory, you have a greater than 50% chance of making money on these types of spreads (when done the traditional way). 

Let’s take a closer look to better understand this.

Bull Put Spread Setup Visualization

The below graph illustrates a bull put spread:

Bull Put Visual

In this example, the stock is trading at $146.92 at the time of trade entry.

Our position is a follows:

 Stock price at entry =$146.92

 Put spread construction = Short the 145 put for $6.60, buy the 135 put for $3.07

 Spread sale price = $3.53 credit received

Key to note here are two factors:

  1. Both options are in the 46-day expiration cycle (remember, all vertical spreads have the same expiration date!)
  2. Since we short the 145 put and collect $6.60 and buy the 135 put for $3.07, a net premium is collected at entry.

Let’s next cover how the maximum profit, maximum loss and breakeven profiles for bull put spreads are calculated.

Bull Put Spread Maximum Profit Potential

Just like in our bull call spread example, we want the price of the stock to go up here. But the mechanics here are a little different. Since we are selling a spread, we want the options that compose that spread to go down in value. 

When do put options go down? When the stock goes up of course. Therefore, our maximum profit occurs when the options are trading at the least value, or zero. They will both be worth zero if the stock closes above our short put strike price of 145 on expiration. 

So if the stock indeed closes above 145, how much will we make? The credit received. Whenever you sell options, your maximum profit is always the credit received. 

Our maximum profit is therefore $353 (our credit received).

Bull Put Spread Maximum Loss Potential

So what about if the trade goes against us? How much can we lose?

We mentioned earlier that this type of trade has a greater than 50% chance of success. The downside to this high probability of success is reflected in the trade’s maximum loss. 

Maximum loss on credit spreads is calculated by subtracting the premium received from the width of the spread. We sold a 10 point spread for $3.53. Our maximum loss is, therefore (10-3.53) $6.47, or $647 in premium. That’s almost twice our maximum profit! It better have a higher chance of winning than losing for that risk!

Bull Put Spread Breakeven Price

The breakeven price for a bullish put spread is calculated by subtracting the premium received from short strike price. Our breakeven is therefore 145-3.53 = 141.74.

Let’s next take a look at these various outcomes in the risk graph. 

So what actually happened to this spread in real life as time passes? Let’s check that out next. 

Bull Put Spread Trade Example (Real Data Visualization)

Here’s how our trade performed in real time:

The top portion of this graph features the changes in the stock price relative to the spread’s strike prices

As we can see early on in the trade, the share price was falling, which caused an increase in the put spread’s price. Since the bull put spread is a bullish strategy, it will lose money when the stock price falls, and make money when the stock price rises.

Fortunately, the shares regained traction and headed higher throughout the remainder of the trade. We can see as time passed and the stock price increased, the spread’s value collapsed.

Closing a Bull Put Spread

At around 17 days to expiration, the spread’s value was very close to $0, which means the trade essentially reached maximum profit.

At that moment, a wise trader would close the put spread to secure the profit. Closing the trade would entail buying back the short 145 put and selling the long 135 put. The P/L on the trade would be the difference between the $353 premium collected at entry and whatever we paid to close the spread. If we paid $20 to close the spread, the profit on the trade would be $333.

But as we can see, the spread continued losing value and ended up with the maximum profit at expiration.

With the stock price at $157.02 at expiration, the 145 put and 135 put had no intrinsic value, and therefore the spread’s value was $0. If a trader held this spread through expiration, both of the options would simply disappear from the account and the trader would be left with the $353 profit.

So far we’ve covered both of the bullish vertical spread strategies. Let’s take a look at a few bearish spread strategies next.

The Bear Call Spread (Call Credit Spread)

These last two strategies on our list are both bearish vertical spreads, which make money as the stock price falls.

The first of these two strategies is the bear call spread, which is a bearish vertical spread constructed with call options.

Bear Call Spread Graph

Bull Call Spread Definition: The bear call spread is a bearish options strategy constructed with call options consisting of the same expiration and quantity.

Spread Components:

  • Short a call option at one strike price

  • Buy another call option at a higher strike price

Aliases: 

  • Bull Call Spread
  • Shorting/Selling a Call Spread
  • Call Credit Spread

How A Bear Call Spread Makes Money

This bearish trade makes money as long as the stock price remains below the call spread’s strike prices. It is therefore similar to the bull put spread we just looked at, except it works in the exact opposite way.

Remember, instead of buying a call spread, we are selling a call spread here. We are simply taking the other side of the trade we talked about earlier. As long as the stock price remains below the strike prices of our position, we will make money. 

Let’s take a look at an example now. 

Bear Call Spread Setup Visualization

Here is a visual of our bear call spread trade, proceeded by the trade details.

 Stock price at entry =$141.46

 Call spread construction = Short the 142 call for $1.93 buy the 145 call for $0.87

 Spread sale price = $1.06 credit received

So what we have here is a 3 point call spread sold for a net credit of $1.06. Since we are bearish, we believe the stock price is going to go down. Since the call we sold was valued more than the call we purchased, this trade results in a net credit, and is therefore a credit spread. The most we can ever make is the credit received.

Let’s next take a look at the different ways this trade can play out.

Bear Call Spread Risk Graph at Expiration

The below chart represents the various outcomes of our trade. 

Bear Call Spread Maximum Profit

Max profit for any credit spread is always the credit received. Therefore, our max profit in this scenario is $1.06, or $106 in premium.

Bear Call Spread Maximum Loss

To determine the maximum loss on a credit spread, simply subtract the credit received from the width of the spread. We sold a three point spread for $1.06, therefore our max loss is (3-1.06) 1.94, or $194.

Bear Call Spread Breakeven

To determine the breakeven on a bear call spread, add the net credit received to the short call option. Since we sold the 142 strike price and receive a net credit of $1.06, our breakeven is therefore (142+1.06) $143.06

Let’s now exit the land of theory and see how our trade actually performed!

Bear Call Spread Trade Example (Real Data Visualization)

Take a moment to study the graph below, which illustrates how our above trade performs over time. 

Bear Call Spread

The first thing to note is the correlation between the stock price and the spread price. Since this is a bearish call spread trade, we want the stock price to fall below the 142 price level by expiration.

About halfway through this trade, with 17 days to expiration, we can see the stock price was approaching the $145 price level. The spread value here was $2.00, representing a $94 unrealized loss at that moment.

But later, after the passage of a few weeks, the stock price declined steadily.

With 2 days to expiration, the stock price was below the call spread’s strike prices and the spread price itself was almost $0. With the best-case scenario being that the spread price falls to $0, it makes sense to close the spread here. Take the risk off!

Closing a Bear Call Spread

To close a short call spread, you need to buy back the short call and sell the long call. In this trade, that would mean buying back the short 142 call and selling the long 145 call. This can be done in the same transaction.

Opening Trade: Short the 142 call, buy the 145 call

Closing Trade: Buy back the 142 call, sell the 145 call

If we paid $0.20 to buy back the spread, our profit would be $86 because we initially shorted the spread for $1.06.

In terms of this spread’s value at expiration, the stock price was at $142.26, which means the 142 call had intrinsic value of $0.26 and the 145 call expired worthless.

Therefore, the price of the 142/145 bear call spread at expiration was $0.26, or a real value of $26.

If we shorted the spread for $1.06 and it had a value of $0.26 at expiration, our profit would be $80.

Ok, let’s move on to our last vertical spread strategy!

The Bear Put Spread (Put Debit Spread)

Bear Put Spread

The final vertical spread strategy is the bear put spread, which is a bearish vertical spread constructed with put options.

Bear Put Spread Definition: The bear put spread is a bearish options strategy constructed with put options consisting of the same expiration and quantity.

Spread Components:

  • Buy a put option at one strike price

  • Sell another put option at a lower strike price

Aliases: 

  • Bear Put Spread
  • Buying a Put Spread
  • Put Debit Spread

How A Bear Put Spread Makes Money

Bear put spreads typically make money when the market falls. Since our position involves a “debit” as well as “puts”, we are essentially long puts, which means we believe the market will go down.

Since the put that we purchased cost more than the put that we sold, this position will require a debit to enter. Therefore, it is a debit spread. 

Let’s now move on to an example.

Bear Put Spread Setup Visualization

The below image is a visualization of our trade, proceeded by our trade details.

Stock price at entry =$780.22

Put spread construction = Buy the 800 put for $44.88, Short the 750 put for $22.63.

Spread sale price = $22.25 debit paid

Bear Put Spread Risk Graph at Expiration

Before we get into the different trade outcomes, take a moment to look at the bear put spread risk graph below.

Bear Put Spread Maximum Profit

The best-case scenario is the stock price falling below $750 and remaining there at expiration. In that scenario, the put spread will be worth the distance between the strike prices, which is $50. If we buy a 50 point put spread for $22.25 and it appreciates to $50, we’ll have a gain of $27.75 on the spread. If we multiply that by 100, we get a profit of $2,775.

Bear Put Spread Maximum Loss

The worst-case scenario is that the stock price is above both put strikes at expiration, in which case both options will have no intrinsic value and expire worthless. In this scenario, we’d end up having a worthless spread which we paid $2,225 for in the beginning, leaving us with a 100% loss

Bear Put Spread Breakeven

The breakeven price at expiration is $777.75. If the stock price is right at $777.75 at expiration, the 800 put that we own will have intrinsic value is $22.25 and the 750 put that we’re short will be worthless.

Therefore, the spread’s price will be $22.25 and we’ll have no profit/loss at expiration.

Next, let’s see what actually happened to this position in the real world!

Bear Put Spread Trade Example (Real Data Visualization)

The below chart illustrates how our bear put spread reacts to changes in the underlying stock price.

Understanding this is a bearish strategy, it makes sense that the trade lost money initially as the stock price was increasing.

When you buy a put spread, you want the price of the spread to increase, which happens as the stock price falls, ideally below both strike prices of the put spread.

Bear Put in Stock Rally

In the first two weeks or so, the stock price went from $778 to almost $850, and the 800/750 bear put spread’s price fell from $22.25 to a low of $10.00.

This decrease to $10 represents a $1,225 unrealized loss on the spread because we initially paid $2,225 for the spread. A reduction in its price to $10 means the spread is worth $1,000. Remember, we always have to multiply the spread’s price by 100 to get its dollar value.

As luck would have it, the stock rally did not last long, and the share price plummeted over the remainder of the trade. 

Bear Put in Stock Decline

We can see that at 14 days to expiration, the stock price was just above $750, which implies the 800/750 put spread was almost fully in-the-money.

The spread’s price at that moment was around $34, or a value of $3,400. 

The stock price fell even further, reaching a low price of $720 when the spread had 4 days left until expiration. At that moment the spread’s price was around $47.50, or $2.50 short of the maximum value of $50.

Closing a Bear Put Spread

We could have sold the spread at that moment for $4,750 and secured a profit of $2,525. To close a put spread that you’ve purchased, you just sell the put spread.

In this example, that would be done by selling the 800 call and buying back the short 750 call.

But if we held the position to expiration, our profit would have been $1,760.

Final Word

vertical spread advantages

Spread trading offers investors both a reduction in risk and cost as opposed to trading single options. Additionally, in spread trading, changes in time decay and implied volatility impact the position less.

The first step when trading spreads is to determine the direction you believe the underlying security will be headed. We have gone over 4 types of vertical spreads so far:

Bullish Spread Strategies

Bearish Spread Strategies

Next up, you must determine the strike prices. Generally speaking, the risk of a trade increases with the widening of the strike price legs. A one-point spread will generally have less risk than a ten-point spread.

Should you have specific questions on your spread, make sure to reach out to the tastyworks trade desk. They are the best in the business!

Vertical Spread FAQ's

Vertical spreads are generally safer than buying or selling single options. For debit spreads, the risk is the total debit paid. For credit spreads, the total risk is the width of the spread minus the credit received.

It is possible to leg out of a vertical spread. Bare in mind that if you leg out of the long option first, that will leave you naked short an option, which can have considerable risk. 

Long vertical spreads can be closed at any time. If held until expiration, it is important that both legs are either in the money or out of the money. One leg being in the money could result in assignment/exercise which will leave a net stock position in the account. 

The credit spread strategy makes money when the options’ spread narrows. The debit spread strategy makes money when the spread widens.

Related Articles

Need a brokerage account?

We trade with tastyworks because of their trader-friendly commissions ($10 options commission cap and close trades for free) and easy-to-use platform.

Sign up with tastyworks and earn up to $500 for funding your first account ($200 for funding $2,000 -OR- $500 for funding $10,000).

Offer valid through 2/28/2022