?> June 2021 - projectfinance

QYLD vs NUSI vs DIY: Which Options ETF Strategy is Best?

QYLD vs NUSI vs DIY: Which Options ETF Strategy is Best?

2022 is proving to be another volatile year. During uncertain markets, it can be wise to diversify your portfolio to both protect profits and generate income from a sideways market. Options based ETFs may provide investors opportunity here.

This article assumes the reader has a basic understanding of options trading. If you are new to derivatives, it may help to start by comparing stocks to options

Additionally, understanding the fundamental difference between calls and puts will be important as well. 

TAKEAWAYS

  • QYLD utilizes the “covered call” approach on the Nasdaq 100

  • NUSI utilizes the “protective collar” approach on the Nasdaq 100 

  • QYLD pays a higher dividend than NUSI

  • Both ETFs will may in a bullish market

Option Trading Enters the Mainstream
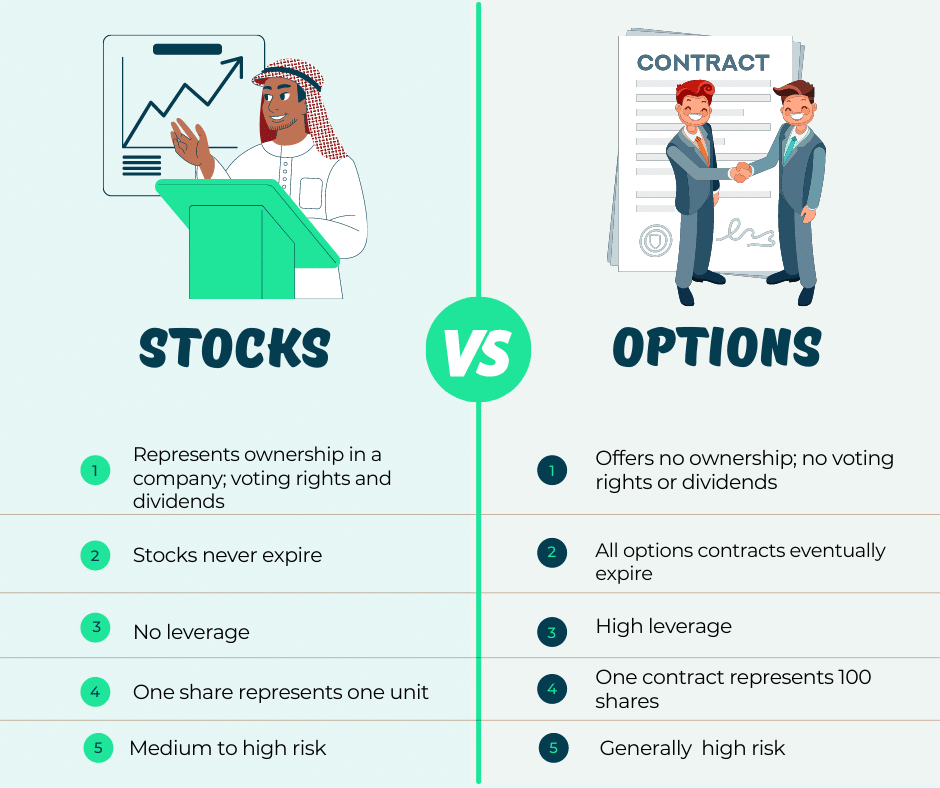
Stocks vs Options

Option-based ETFs have been soaring in popularity recently. Why? The average investor is becoming savvier. Before we start putting Global X’s QYLD ETF and Natiowide’s NUSI ETF under the microscope, let’s take a quick look at what’s been going on in the options markets.

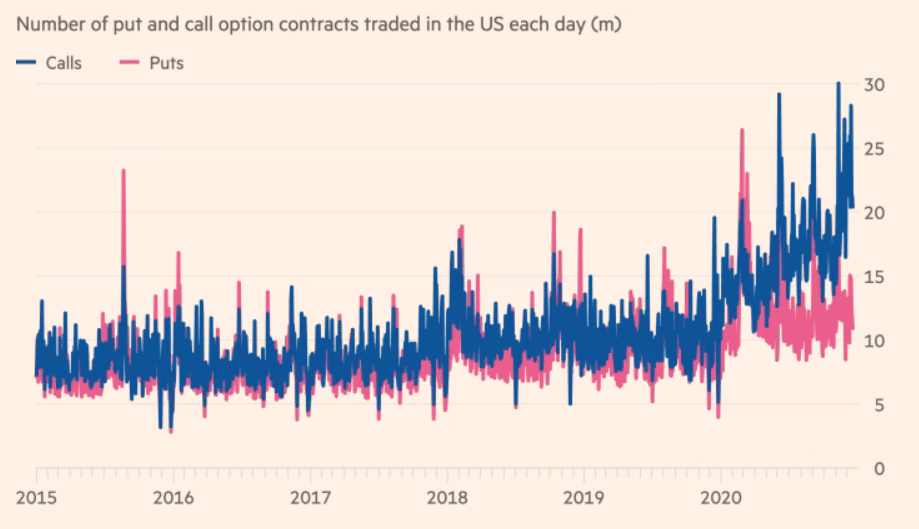
An Explosion in Option Activity

Date from CBOE.com; image from ft.com

When sports betting came to a screeching halt on the tail of the pandemic, risk-takers went searching for other ways to appease their insatiable appetite for gambling. It didn’t take long for them to discover a viable, even seemingly legitimate alternative – options trading

In 2020, a record 7.47 billion options contracts were traded. That’s about one contract per human on Earth. A lot of money was made and lost over the past year in options markets. In the eye of the mainstream media, options trading has become synonymous with gambling. 

Judging from the way most of these new traders utilize the leverage that comes with options trading, their analysis would be correct. The vast majority of these “Robinhood” traders are known in the industry as “premium buyers”.

Premium Buyer Example

An example of a premium buyer is a trader who buys, or “goes long”, a call option on Apple (AAPL). AAPL is currently trading at $135/share. If an option trader believes the price of AAPL will rise to $145 by next month, they could purchase a call option today for that corresponding expiration (we’ll say July 30th expiration since today is June 30th) for a premium of $1.89. 

In order for that customer to break even on this trade, AAPL would need to rally to $146.89 in 30 days. This number is the summation of the strike price (145) plus the premium paid ($1.89). The stock needs to go from $135 to $ 146.89 in one month just for that trader to break even. That’s an increase in the price of about 8%. What are the odds AAPL rises 8% in 30-days? Not great.

Using Options to Hedge Risk

Today, the vast majority of options are used as vehicles for market speculation. 

This was not the original intent of options trading when the Chicago Board Options Exchange (CBOE) was created in the 1970s. On the contrary actually: stock and index derivatives were actually created as a way for market participants to mitigate risk. 

Two such risk-reduction strategies are the covered call and the collar. These strategies are utilized in Global X’s NASDAQ 100 Covered Call ETF (QYLD) and Nationwide’s Risk-Managed Income ETF (NUSI), respectively.

Many investors bundle these ETFs together as the same. This would be a mistake. 

There is an ocean of differences between the two. The most important difference is perhaps risk: QYLD has a lot more risk than NUSI. 

Why? Let’s break down both of these ETFs so we can better understand the strategies used. 

If you already have a working understanding of options, we are going to also examine how a savvy investor can avoid the fees of these ETFs and create a covered call and/or collar position on their own.

Global X, the parent of the Global X NASDAQ 100 Covered Call ETF (QYLD), defines its buy-right (covered-call) strategy as follows:

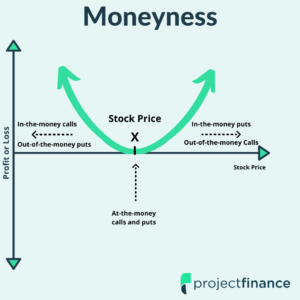
What does this mean? The fund simply buys the stocks within the Nasdaq 100 and sells monthly index (NDX) at-the-money calls against these stocks. Since it tracks the Nasdaq 100, we can use the Nasdaq-100 Index (NDX), or the Invesco QQQ ETF interchangeably as benchmarks. The Nasdaq is composed of primarily growth companies, which is another name for low dividends. 

However, the QYLD provides an exceptionally high dividend yield of 12.46%. How is this possible? The fund generates income by selling calls on the index.

Notice the benchmark QYLD tries to replicate. What is interesting about the “BuyWrite Index”, as well as QYLD, is the strike price of the calls they sell. Unlike traditional covered calls, this fund sells calls that are at-the-money. This strategy gives them little upside room in a bull market. The below is taken from the funds “factsheet”.

Let’s take a closer look at how covered calls work before we continue. 

How a Covered Call Works

covered call is a financial transaction in which investors write call options against shares they already own (100 shares per contract). As long as the stock price stays below the strike price of the call sold, an investor will collect the full premium of the option sold. 

Below are two potential reasons why an investor would use this strategy.

Collect Income: If an investor doesn’t believe a stock they own will rise to a certain point by a certain time, they can sell a call option at this strike price and collect the premium received as income.  

Target an Exit Price: If an investor wishes to sell a stock once it reaches a certain level, they can sell a call at this corresponding strike price. Once the stock breaches this level, they will be “called out” of their long shares.

For investors using the covered call as a means of income generation (first example), they will sell a call at a strike price that they don’t believe the stock will reach. 

If an investor wishes to sell their stock in the future, they are more likely to sell a call that is closer to being at-the-money, which will act similar to a limit sell order (second example).  When the stock reaches that point, their call will be assigned and they will sell their stock. In the meantime, they sit back and collect the income.

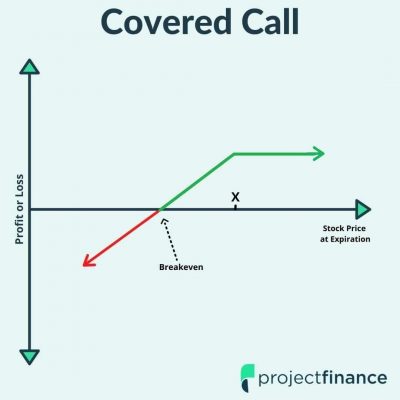
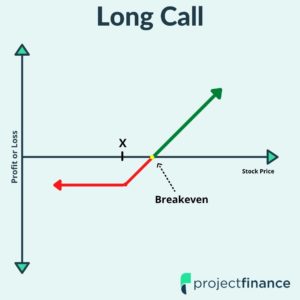
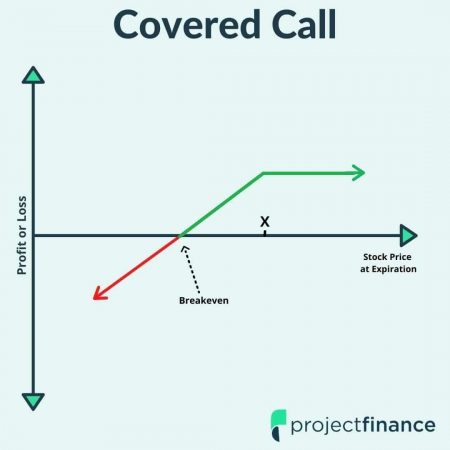
The below image is a traditional chart for a covered call that incorporates an out-of-the-money call, where “X” represents the strike price of the call sold. 

The QYLD Approach

QYLD uses a different method. They sell at-the-money calls. When you sell an at-the-money call, you greatly limit upside stock potential. That being said, the premium you collect for an at-the-money call is far greater than the premium you receive for out-of-the money calls. 

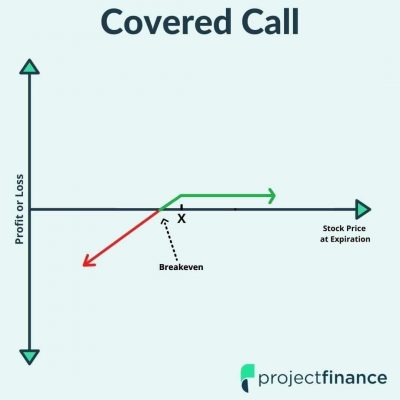
The below represents a chart for a covered call with the sold call being slightly out-of-the money. In reality, the at-the-money green line will be below this line for the at-the-money strategy, but it helps to give you an idea of the structure. 

This graph shows that QYLD should benefit greatly in a neutral market. 

Does the greater premium received by selling an at-the-money call make up for the loss in potential price appreciation? In theory, QYLD was designed to generate income, not appreciate in price. That being said, let’s see how the fund has historically performed in relation to the Nasdaq 100 (as represented by QQQ) by comparing them in Y Charts.

QYLD in a Bear Market

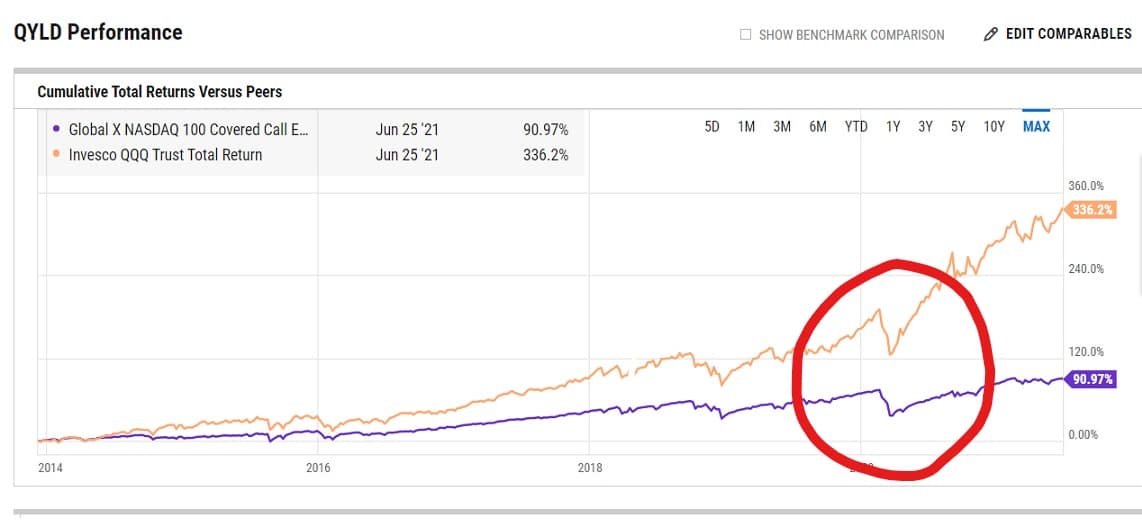
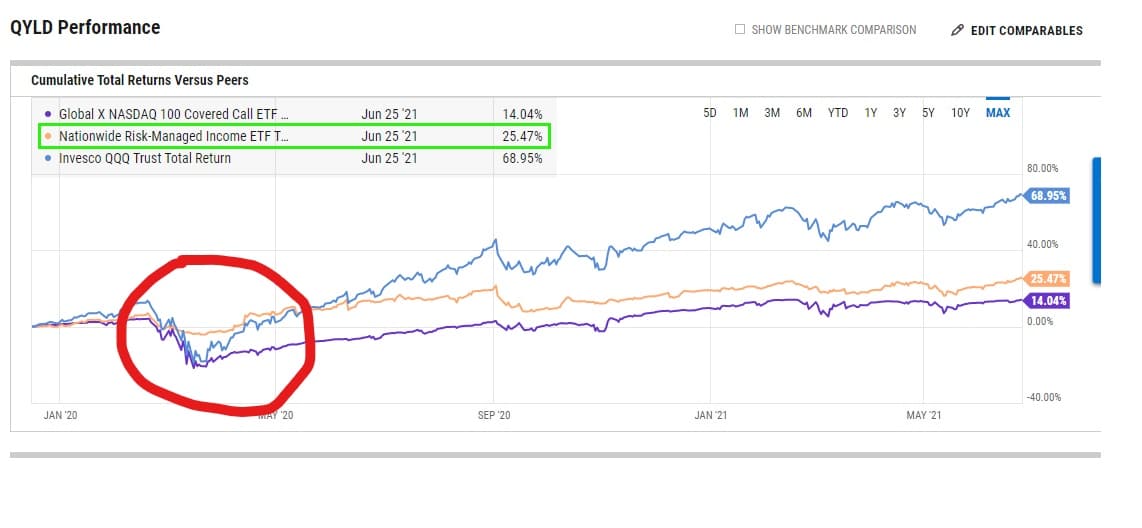
The above chart compares the total returns of QYLD vs QQQ. That means QYLD’s fat dividend is included.

Note that we are comparing QYLD to the QQQ ETF and not its true benchmark, the CBOE NASDAQ-100® BuyWrite. This is a rather esoteric index, and we thought it better to compare QYLD to the unhedged stocks which it tracks. 

What is concerning in this chart comparing QYLD to its representative ETF, QQQ, is how poorly QYLD performed on the tail of the pandemic. QYLD took a very large hit, and has only now, over a year later, just barely recovered. Meanwhile, QQQ has been soaring. 

Selling covered calls is a great strategy for a market that is either stagnating, minorly bullish, or in a minor correction. When a doomsday scenario hits, like the pandemic, QYLD doesn’t do that much better than its benchmark on the downside. For an ostensibly risk-hedged position, I’d expect more protection.

Why such limited downside protection in a seemingly volatility resilient ETF? The downside protection on QYLD is limited to the premium received from the covered call. Once the market falls by that relatively small amount, you lose money on a penny-for-penny basis with the index.

QYLD in a Bull Market

Not only did QYLD merely mirror the QQQ losses when the pandemic hit, but it also failed to partake in the recovery. We can see this in the area to the right of the dip circled above. Why? The calls that the fund sold were a ballast to the upside potential. When you sell a call, your upside is limited to strike price + premium sold. When the QQQs had some of their huge 5%+ upside months during the pandemic, this fund was limited to a fraction of these gains.

The Future of QYLD?

We are living in strange times. Will market volatility ever subside? If not, QYLD may prove to be a poor investment. We have already proven the fund performs poorly in both very volatile times as well as bull markets. 

But let’s say the market does calm down. Many analysts believe the stock market is due for a breather. During a neutral market (which we haven’t seen much of since the fund’s inception) this fund may prove to be very lucrative, surpassing even the total return of the QQQs. 

But will that happen? Who the heck knows!

Let’s next take a look at Nationwide’s NUSI fund, which is by far a much more interesting ETF.

Nationwide’s Risk-Managed Income ETF (NUSI) is a relatively new ETF to the scene, with a fund inception date of December 2019. It is a true capital preserving and income-focused fund with a very low expense ratio (considering the work performed) of 0.68%. 

Here is how Nationwide defines its fund:

Does that sound too good to be true? Perhaps, but they’ve had a heck of a good run thus far; a 7.89% dividend yield with outstanding downside protection is nothing to sneeze at. How do they do it?

Nationwide’s NUSI ETF has a lot in common with QYLD, with one important difference; NUSI has substantial downside protection. Both QYLD and NUSI provide a source of income by selling calls against the Nasdaq 100, but NUSI goes one step further and buys a put to further hedge downside risk.

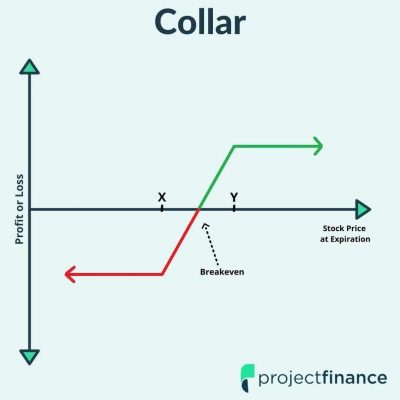
This strategy, which involves selling a call and buying a put in combination with long stock, is called a “Protective Collar”. 

Let’s take a moment to see how the protective collar works before we continue.

How a Protective Collar Works

The difference between the collar chart above (representing NUSI) and the covered call graph (representing QYLD) is that the red, loss line flattens out with the collar. You’ll notice that the strike price of the long put (X) protects the fund from catastrophic losses. The QYLD ETF, on the other hand, can in theory go to zero. Protective collars, therefore, are a true risk-defined strategy, whereas the covered call provides minimal downside protection.

"Costless" Collar

A collar position can be established so that the premium collected from the short call pays for the long put protection. This is called a “costless” collar because the put doesn’t cost us extra money. Sometimes, you can even collect more from the short call than you pay for the put. 

In this case, you are going to receive a net credit from the transaction. That is how NUSI trades collars and is the reason for their generous dividend yield of 7.89%.

I just went through NUSI’s holdings and was able to locate the two current positions constituting their collar:

  • Short NDX July 16 14,600 Call for a net credit of 78.45
  • Long NDX July 16 12,775 Put for a net debit of 17.30

The net credit here is 78.45-17.30 = 61.15.

And there’s your dividend. 

2 Advantages of NUSI over QYLD

In addition to having greater protection, NUSI has several more advantages over QYLD. Here are two.

Manager Discretion: A potential advantage of NUSI when compared to QYLD is the discretion the managers have. We’ll remember that QYLD uses a formulaic approach to selling. They sell at the money call options 30 days out. That’s it. NUSI gives their managers more control here. They are not very transparent about the methodologies, but this discretion appears to be working to the fund’s advantage.

Moneyness Structure: NUSI sells out of the money calls (and buys out of the money puts). This call selling strategy gives them more room on the upside when compared to QYLD, which sells at-the-money calls. The 7.89% dividend yield is produced by selling calls that are further out of the money than the puts which are bought. 

Let’s next take a look at how the very young NUSI performs over various market cycles. 

NUSI in a Bear Market

NUSI vs QYLD vs QQQ Total Returns

Nationwide’s NUSI is a young fund. It has only truly been tested once, during the pandemic (the orange line in the red circle above). When compared to QYLD and QQQ, it performed superfluously well. The long put hedged the fund against the steep losses the NDX incurred. NUSI performed just beautifully.

I wonder how NUSI will perform over a longer, less volatile bear market. Since it seems to be an adaptive fund, only time will tell.

NUSI in a Bull Market

I was surprised to see that QYLD did not vastly outperform NUSI during the past year. During this time, QQQ skyrocketed (as you can see in blue). Since NUSI is buying puts, shouldn’t that be a drag on their performance relative to QYLD, which doesn’t buy puts at all, but only sells calls?

A possible reason for the superior performance of NUSI could be in the strike price of the calls sold. QYLD, you will remember, sells at-the-money calls. These calls drastically limit upside potential and prevents the ETF from participating in large rallies, as the QQQs have seen this year. 

NUSI, on the other hand, sells out-of-the-money calls. This gives them more wiggly room on the upside.

A possible reason for the superior performance of QYLD could be in the strike price of the calls sold. QYLD, you will remember, sells at-the-money calls. These calls prevents the ETF from participating in large rallies, as the QQQs have seen this year. 

The Future of NUSI?

It is far too early to tell how NUSI will play out in the years to come. NUSI was created only in late 2019. We know it performs well in very volatile times and holds its own in bull markets. But how adaptive will it be if and when markets calm down? Since the managers have some discretion here, it’s completely in their hands.

It should be noted that the volatility of 2022 has taken a large chunk out of NUSI’s value.

The DIY Approach

For all they provide, the expense ratios for both NUSI and QYLD are exceptionally low. If you were to replicate these strategies on your own, not only would you need the options expertise, but you would also have to pay commissions on options contracts, which adds up over time. Additionally, you’ll need a lot of money.

Both NUSI and QYLD buy every individual stock within the Nasdaq 100 – can you imagine how much time and money this would take to do on your own? 

Additionally, there are more risks involved when trading options on your own, such as “pin risk” (when the stock closes right at your strike price on expiration), as well as “dividend risk”, which you always have to keep an eye on when you’re selling calls. 

That said, there is nothing preventing you from doing a covered call or a collar on a broad ETF such as QQQ. The at-the-money call selling that QYLD utilizes is not for everyone. If you did it on your own, you could sell that call a little further out of the money, thus making your position slightly more bullish. 

If you’d like to learn more about trading covered calls and collar positions on your own, please check out our videos below!

Collar Tutorial

Covered Call Tutorial

Even if you decide to not go the DIY route, the covered call and collar strategy are nonetheless great strategies to have in your toolbox. Covered calls are a fantastic way to earn extra income in a sideways market; collars can be beneficial to hedge individual stocks against times of high volatility, such as earnings.

Conclusion

So far, NUSI appears to be the winner over QYLD, but that could all change rapidly. I have a feeling we are going to be seeing a lot more ETFs based on options strategies in the near future. If neither of these fit your risk profile, there should be plenty more coming down the pipeline soon. 

Happy trading.

Additional Resources

Inflation and the Stock Market in 2022: 6 Sectors to Consider

Inflation's Economic and Human Impact

In 2021, financial news headlines have been dominated by one word: inflation. All indicators point to his trend continuing throughout 2022 as well. 

Inflation can be defined quite simply as a broad increase in prices. What prices are we talking about here? Everything. From the orange juice in your glass to the rubber on your tires. When the tidal wave of inflation comes, it lifts nearly everything in its path. 

The dangers of inflation on human lives are real, particularly for the elderly.

Generally speaking, a person’s income becomes more fixed as they age. Americans in their twilight years may be relying completely on the income from fixed securities. The danger here comes when the cost of living surpasses the income received. What will a retired senior citizen do when the interest they receive on investments can’t keep up with prices; what will they cut out when their weekly budget for groceries rises suddenly from $100/week to $150/week?

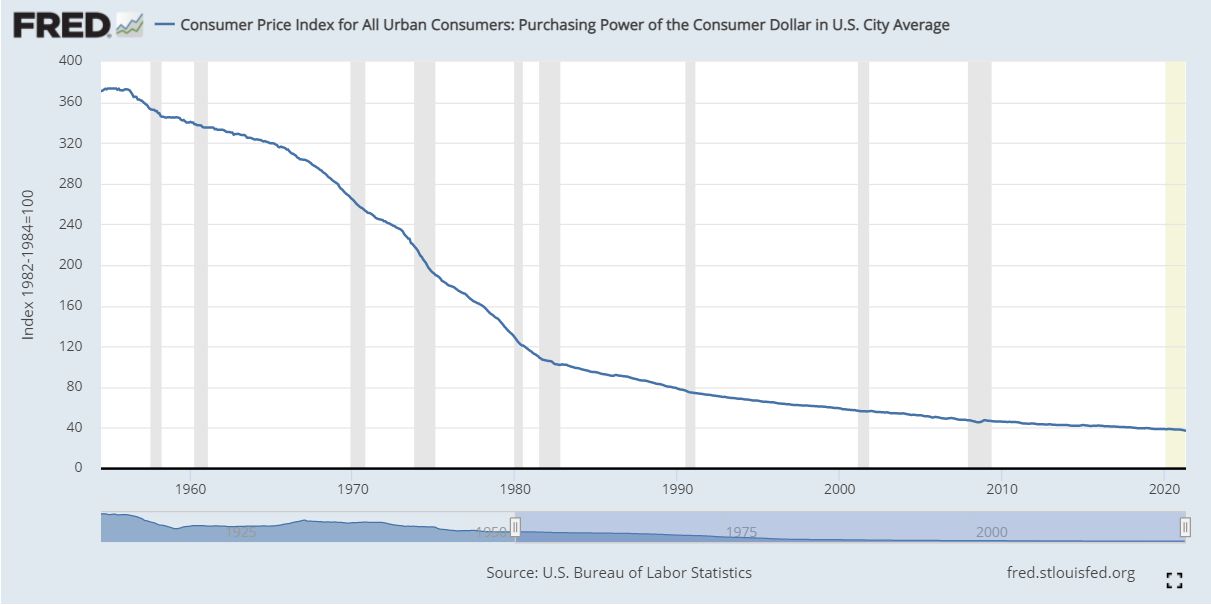
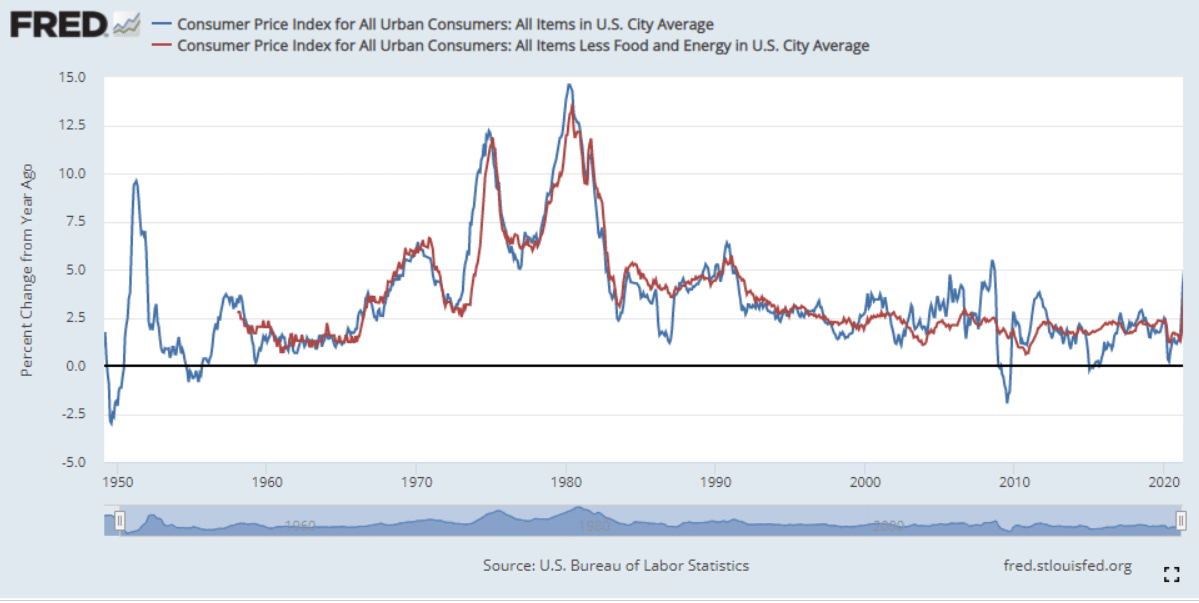
 *The above chart from the St. Louis Fed shows the decline in purchasing power which occurred during the 1970’s. Are we headed there again?

The elderly are not the only ones at elevated risk during times of rising prices; the poor are also disproportionately hurt by inflation as well. Inflation is sometimes referred to as a tax on the poor for this reason. 

Inflation Advantages

With that being said, inflation brings with it some upside as well. Moderate inflation is even encouraged. Inflation can increase wages, lower unemployment, and spur economic growth. When confronted with the choice between “deflation” (a general decline in prices) and “Inflation”, economists will always choose inflation, so long as it’s moderate

Moderate inflation is normal and healthy. Can you imagine if a Hershey’s chocolate bar still “cost a nickel”?

What concerns us here is what happens when inflation rises above the Federal Reserve’s recommended level of 2% or below.

This level was recently breached, and a lot of powerful heads are turning. What are they watching? 

Before we continue, let’s take a look at a few potential economic cons that excessive inflation brings.

Excessive Inflation Economic Cons

  • A wide increase in prices often leads to greater economic uncertainty
  • Cost of Borrowing Increases
  • Personal Savings decline in proportion to increasing prices
  • Broad decrease in purchasing power
  • Excessive inflation can trigger a recession

So this is what could happen if excess inflation hits our economy, but are we headed in that direction presently? That is the million-dollar question.

Is Inflation Coming?

If inflation has been the financial word of the year in 2021, then the word “transitory” comes in second place. 

That is the word Jerome Powell, the chairman of the Federal Reserve, used to describe the most recent rise in prices in the US. Take a moment to examine the chart below from The US Bureau of Labor Statistics, which illustrates the historical percentage change in two CPI (Consumer Price Index) metrics. This index measures changes in the price level of a weighted average market basket of consumer goods and services purchased by households.

What concerns investors here is the far right side of the chart. There has been an obvious jump in prices, but, at the moment, it doesn’t appear overly threatening. Investors, however, aren’t concerned about its current level: they’re concerned about where it could potentially go. 

This uncertainty has been the catalyst to recent market volatility. Who’s to say it won’t keep going up? Can anyone guarantee inflation won’t reach those levels seen in the early 1980s, triggering all those “Inflation Cons” we looked at above?

Ominous Signals

A study conducted by the University of Michigan recently found that consumer expectations for overall price changes jumped from 3.4% to 4.6% last month. The director of the program, Richard Curtin, stated that this was, “biggest rise in inflation concerns the study has found over the last 50 years.”

That is concerning. However, Curtin also believes that a strong job and income outlook could help to offset portions of the rising inflation sentiment. 

When it’s all said and done, Jerome Powell’s hope that the current bout of inflation will be “transitory” appears less likely. The market has been relatively resilient to the latest increase in inflation, but how much higher can the market go before some investors start throwing in the towel, and will they at all?

Inflations Impact on Stocks

So what are the effects of inflation on the stock market? Broadly speaking, stocks tend to do well during periods of high inflation. That is a very generalized statement. Though inflation is very easy to define, the economic repercussions of inflation are manifold. 

In theory, an increase in price should result in an increase in revenue, thereby elevating stock prices. The danger comes when input prices increase at a rate greater than revenue. If an orange juice manufacturer is paying more for oranges than they are selling the juice for, that’s no good for business.

Another component to factor in when examining inflation is the market cycle. If inflation occurs during a market expansion (as we are currently in) stocks generally perform well. 

But what if we were in a recession when inflation hit? The US experienced an awful period of “stagflation” during the 1970s. Stagnation occurs when high inflation combines together with high unemployment and stagnant demand. The market performed so horribly during this time of inflation that stockbrokers were known as “waiters”. 

But we are not in a recession today. Quite the opposite actually. With the exception of a few hiccups (labor and inventory shortages), the United States has roared back to life as never before. Even with the inflation fears, the S&P 500 is at a record high as I write this article. 

Red Flags

With all that being said, there are clouds on the horizon. Rising yields and Fed tapering are two red flags that could precipitate inflation. Both of these factors are broadly considered to be negative for equities in general. Yet, stocks continue to climb. 

So which stocks will perform the best in this environment?

Before we explore a few trade ideas to help hedge your portfolio against inflation, it is important to note the already elevated price of many of these securities

Premium for Inflation Hedges

In mid-2021, inflation hedged assets are not a novel idea. Money has been pouring into these securities for the past few months in anticipation of rising inflation, thus driving up the prices. If you decide to diversify your portfolio to include inflation hedges, it’s important to know that if inflation does not meet the lofty prices expected by many, these securities could very well lose more money than the overall market. 

In other words, it’s likely your “hedge” could cost you much more than if you had no protection at all. 

But if you’re of the “better late than never” mentality, here are a few sectors and stocks which tend to hold their own during inflationary times.

1) Consumer Staples

Consumer staples tend to perform well during times of rising prices. Staples consist of goods and services which are used on a daily basis, such as clothing and food. People are willing to pay up for essentials (because they have no choice), and the companies producing these goods and services can therefore pass on their increased input costs to the customer. Here are a few of the more popular stocks and ETFs in this sector.


Consumer Staple Stocks

  • WalMart (WMT)
  • Procter & Gamble Co. (PG)
  • General Mills Inc. (GIS)


Consumer Staple ETFs

2) Commodities

Commodities are often thought to be a leading indicator of inflation because they represent the building blocks of an economy. A cereal company such as General Mills would never dramatically increase the price of a box of Cheerios unless the cost of oats was soaring. In that vein of thought, commodities can be thought of as an extension to consumer staples, in that these staples are composed primarily of commodities. You don’t have to look far to see how these two sectors connect – even the cost of your toilet paper has gone up recently because of skyrocketing wood and lumber prices.

Commodity Stocks

  • Archer-Daniels-Midland (ADM)
  • West Fraser Timber (WFG)

Commodity ETFs

3) Gold

Though technically a commodity in itself, gold gets its own section on this list because of its historically superior performance during inflationary periods. Though lately gold has been losing some of its luster due to the rise of cryptocurrency and bitcoin ETFs like ProShares BITO

To keep up with rising costs, governments often print money. When you have more of anything, its value goes down. Investors frequently flock to gold during these times because of its scarcity. You can’t print bullion as you can a dollar bill. 

Gold Stocks

  • Newmont Corporation (NEM)

  • Barrick Gold Corp (GOLD)

Gold ETFs

4) Real Estate

Investors in real estate tend to do better during times of inflation than the market in general. Property prices tend to rise with inflation. With an increase in property prices comes an increase in rent. This scenario just adds to why many call inflation a tax on the poor. 

That being said, real estate prices are at the moment extremely high. As noted in the Wall Street Journal, this tactic may backfire.

Real Estate Stocks

  • Simon Property Group (SPG)

  • PulteGroup, Inc (PHM)

Real Estate ETFs

Additionally, you can direct in Real Estate Investment Trusts. You can learn more about equity REITs and mortgage REITs in our article here. 

5) Treasury Inflation-Protected Securities (TIPS)

In a normal, mild inflationary environment, bonds are a great investment. They offer a reliable source of relatively low-risk income. During times of high inflation, however, bonds are notorious for their poor performance. Since the value of money is going down, so is the value of the interest we receive on bonds. What good is a 2% yield on a bond if inflation is growing at 5%? 

This is when TIPS (Treasury Inflation-Protected Securities) ETFs come in handy. These kinds of securities take into account cost-of-living increases and adjust their principle values right along with inflation. It is also worth noting that when prices begin to decrease, these types of bonds will underperform more traditional bonds

TIPS ETFs

6) Healthcare

Last on our list in the healthcare sector. Why? Healthcare demand is largely immune to inflationary pressures. Big pharma and biotech stocks alike should remain resilient (if not thrive) while other sectors are struggling with rising prices. 

Bankrate has produced a great list of healthcare ETFs. Here are a few of the highlights from this list:

Healthcare ETFs

Final Word

Nobody can say for certain where inflation will be in two months, let alone three years down the road. The media has been engaged in a months-long tug-of-war on the subject, and no winners have emerged yet. Inflation has indeed been rising, but it is too soon to tell whether it will rise high enough to affect the markets materially. 

When making adjustments to your portfolio, try to not only consider what you may gain by making adjustments for inflation but also what you may lose in any specific sectors should inflation indeed prove transitory.

Trading Earnings With Options: Strategies

Trading Earnings With Options

The Basics of Earnings

Publicly traded companies are required by the Securities and Exchange Commission (SEC) to update shareholders on their performance on a quarterly basis. These reports are highly anticipated by shareholders because they give them a window into a company’s financial health. 

Typically, earnings per share (EPS) and revenue are the two most important components of an earnings report for investors. In addition to these two metrics, a company is required to communicate numerous accounting details to their shareholders in their earnings report. Some of these numbers include a company’s:

  • Net Income
  • Operating Expenses 
  • Cash Flow

Companies also provide within their earnings report guidance for future expected performance. Sometimes, a positive forecast can help offset poor financial performance and vice versa.

Companies typically issue earnings around the same time. This period is known as “earnings season”, and it happens every quarter. 2022 is shaping up to be a particularly volatile year in regards to earnings. 

When compared to stock, options offer investors more ways to capitalize off of earnings-related stock moves. 

Earnings and Volatility

Leading up to a company’s earnings report (which is typically released just before market-open or after market-close), a stock’s share price becomes more volatile. Once the information within the report has been disseminated, the volatility typically returns to its normal levels. 

The market’s interpretation of earnings reports is not always black and white. Sometimes, a company can post extraordinary financials, but a poor forecast can send the stock plummeting. 

Other times, a stock can either soar or tank for no apparent reason. Earnings reports on companies like Amazon (AMZN) can sometimes baffle investors. It isn’t uncommon for this stock to soar hundreds of dollars on the tail of an earnings announcement, only to open lower the next day. And why does the stock go down? Many analysts give their opinions, but a lot of the time, nobody knows – no matter what they say.

What interests us as option traders here is the volatile environment leading up to an earnings call. To see how reactionary option contracts are to earnings, take a look at a front-month (the closest expiration cycle) options chain on a stock before and after earnings. If the earnings report was in line with expectations, you’ll see every single option contract trading at a significantly reduced price. 

Traders Love Volatility

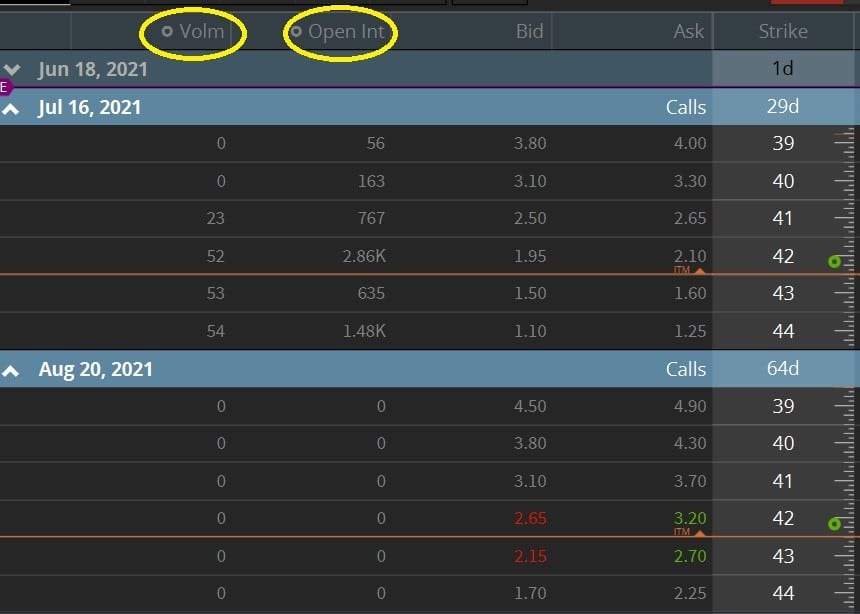
This collapse in price is known in the industry as “vol crush” (volatility crush – Nasdaq). Option traders love volatility, and stocks are typically at their most volatile leading up to an earnings report. To prove this, just take a look at the pre-earnings report volume and open interest of call options for Plug Power Inc (PLUG) below, courtesy of tastyworks. These numbers are typically inflated going into earnings.

Take note of how the options volume quite literally falls off a cliff for the August expiration, which is post-earnings.

Options markets can even give us a general idea as to how far a stock will rise or fall post-earnings. How is that possible? Let’s examine the “expected move” next.

The Expected Move

Before we get into understanding how a straddle can do a decent job at predicting the expected move of a stock post-earnings, we must first understand implied volatility, which tells how inflated the volatility is for a particular option expiration cycle.

Implied Volatility

The implied volatility of a stock, or “IV”, uses options to estimate the future volatility of a stock. The IV is of particular importance to those trading options on stocks going into earnings. 

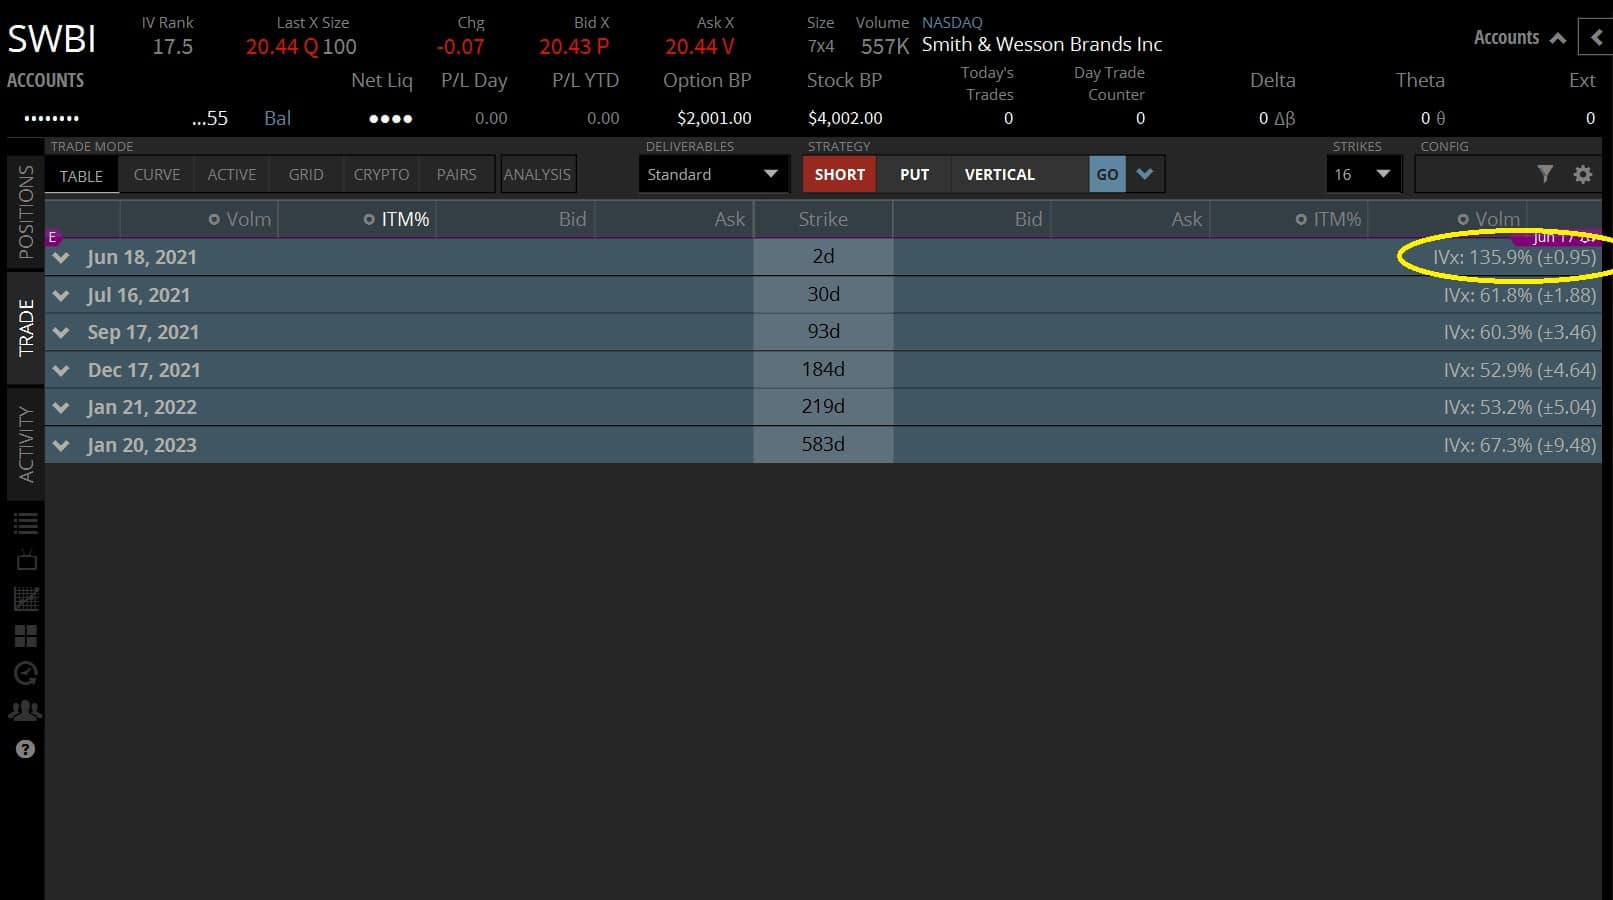
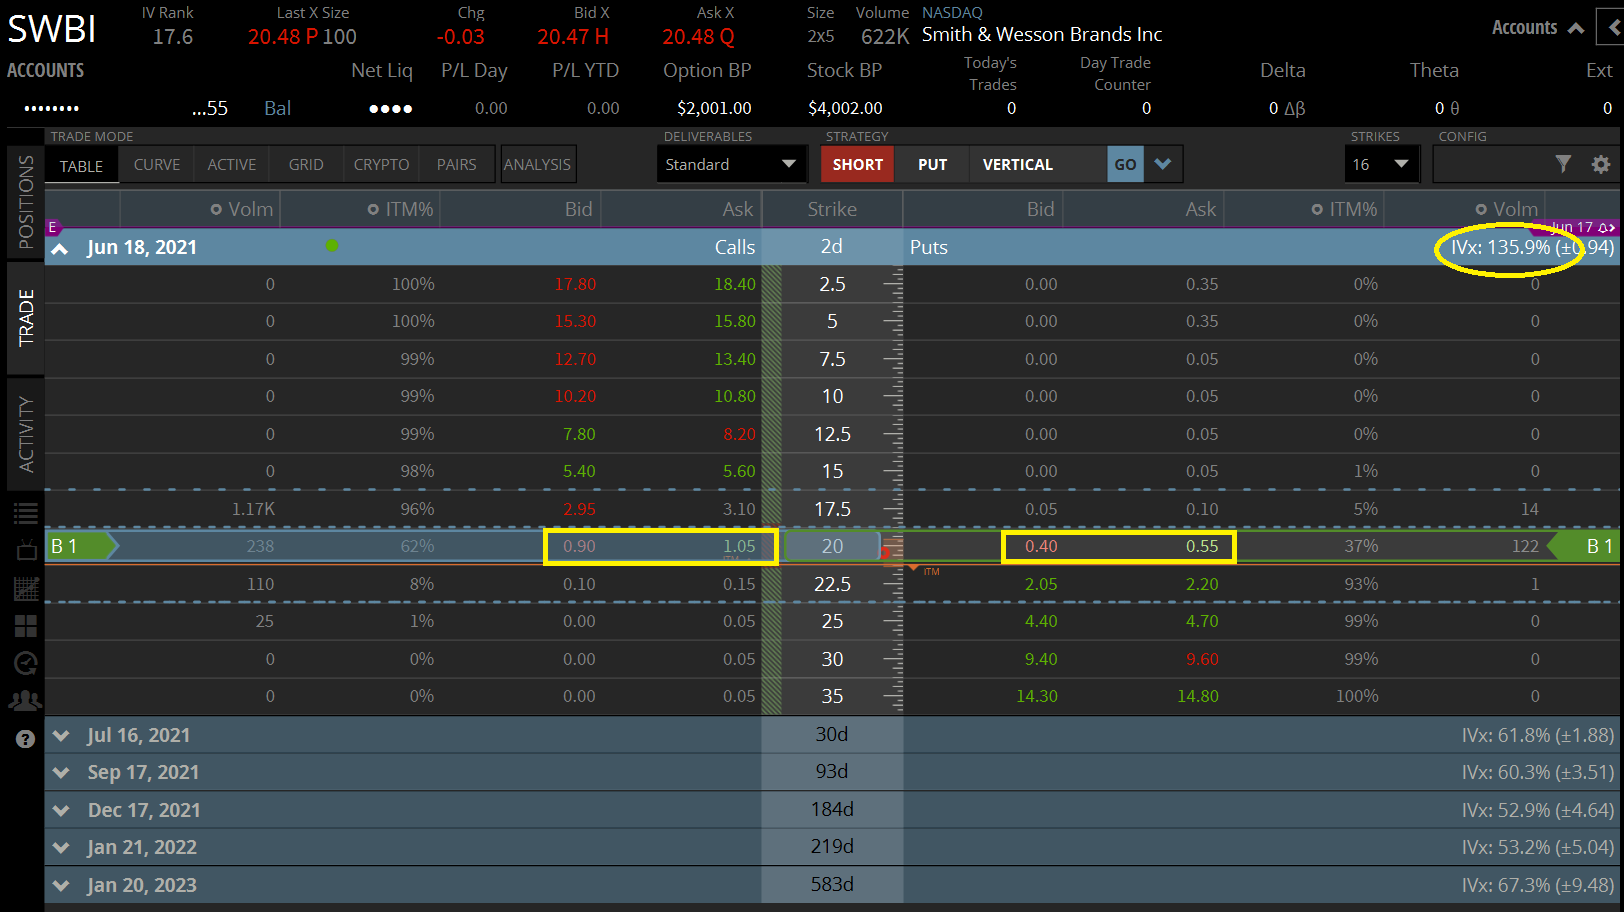
To see how “IV” increases for near-term (or “front-month”) option expirations, take a look at the image below (click to enlarge). This screenshot (taken from tastyworks) shows the options chain for Smith & Wesson Brands Inc (SWBI), which will release earnings later this week. 

We can see that the SWBI options expiring in 2 days, the June 18th cycle, have an “IV” of 135.9%. Compare that to the IV of other months, which have an average IV of between 50% and 60%. This means the premium of these contracts has twice as much juice as those of later months. 

Why? SWBI was slated to post earnings after the market on this day. Earning means more uncertainty, and uncertainty is synonymous with volatility. After the earnings are released, the volatility affecting these front-month options will likely fall dramatically to be in line with the IV of other expirations.

Volatility Crush

This is referred to as the “Vol Crush” (volatility crush) we touched on earlier. Many beginner options traders learn about vol crush the hard way. I can’t tell you how many absolutely baffled customers have called me trying to figure out why their long call was down post-earnings when the stock was up. I explain to them vol crush; that not only do you need the stock to go up post-earnings for a long call to profit, but you’ll also need it to go up a lot. 

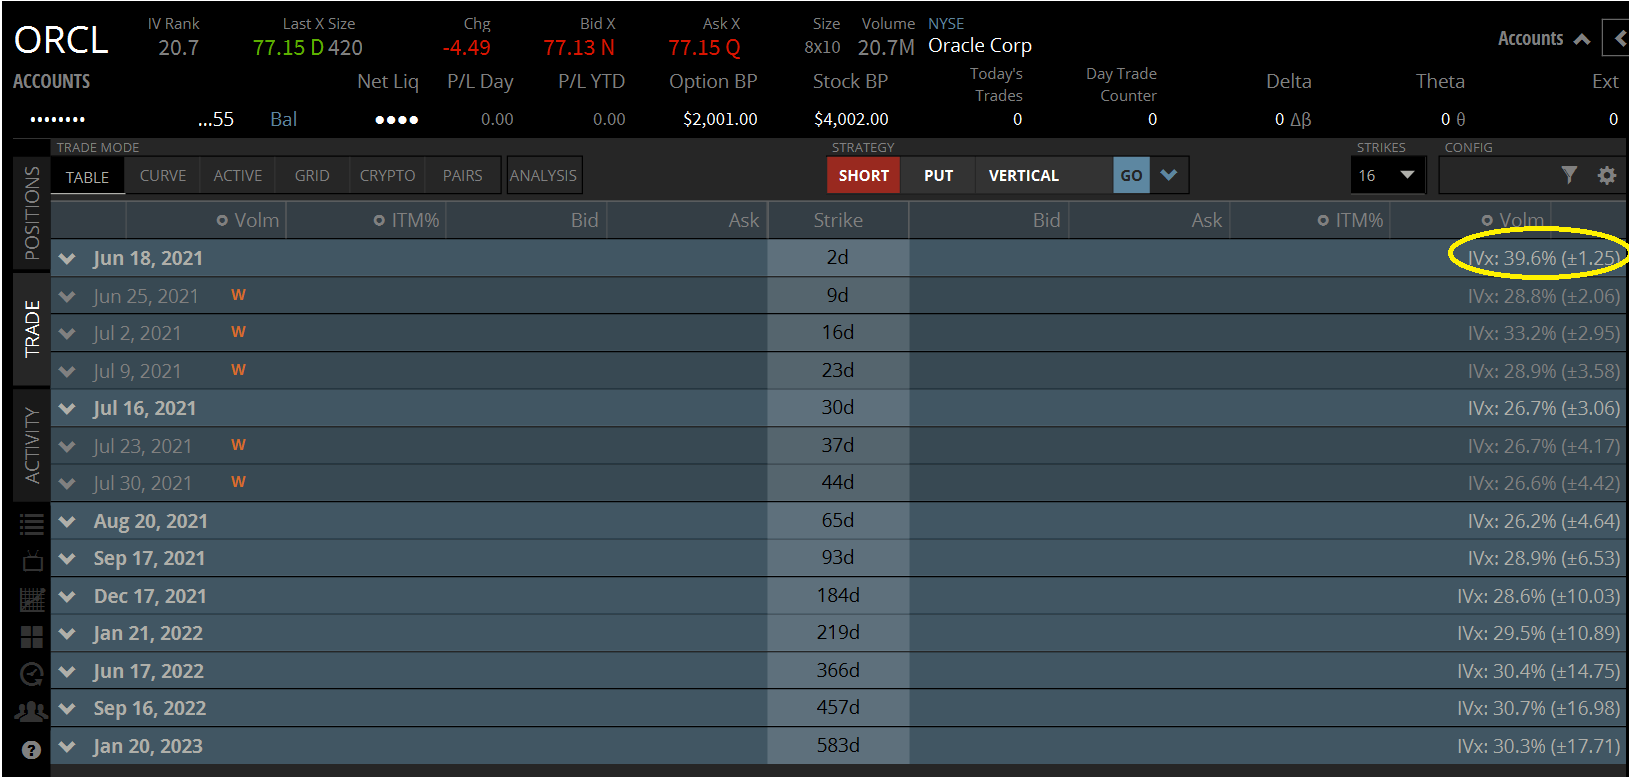
The below image (courtesy of tastyworks) shows the implied volatility of Oracle (OCRL), which just released earnings the day before this article was written. Take a look at the implied volatility of the front-month options.

With the uncertainty removed, the front-month options have more fell in line with the options of other expiration cycles. You may notice that the front month IV is still slightly elevated. This could be because the earnings were poorer than expected, and ORCL is down significantly today. Investors have not yet digested all the news, and therefore the volatility has not settled completely, but it has fallen significantly. 

Straddles Measure a Stock's Expected Move

The expected move (or range) of a stock can be determined by using the “Straddle” options trading strategy. The legs of this straddle must consist of the nearest-term expiration listed for a stock and also of an expiration that expires after the earnings are released. 

Options expiring a year out are bound to behave less reactionary to earnings when compared to options expiring next week. So make sure you look at the “front-month” options series when checking the straddle. 

A straddle simply involves buying (or selling) the at-the-money call and the at-the-money put option together on the same expiration. Since we are only using this strategy as a tool to gauge movement, it doesn’t matter if we are buying or selling. We’re only concerned with the net premium.

Let’s say a stock is trading at $100 and its earnings will be released tomorrow. We can look at the option chain expiring next week to get an idea of the stock’s expected move post-earnings. We do this by adding the combined value of both the at-the-money call and put. Let’s review how straddles work before we move on.

Straddle Mechanics

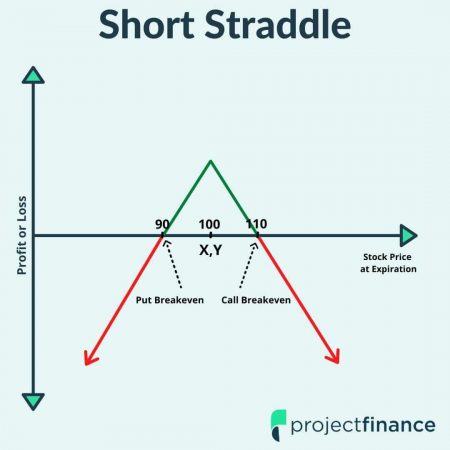
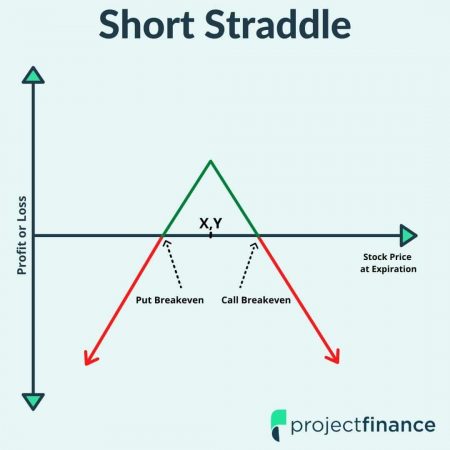
So let’s assume we don’t believe a stock is going to move at all post-earnings. The stock is currently trading at $100/share. We decide to sell a straddle on this stock by selling the at-the-money 100 call (Y) and the at-the-money 100 put (X), as illustrated in the graph above. 

Both of these options were valued at $5, so the total premium we took in was $10, which is also the expected move of the stock post-earnings. As long as the stock stays within this $10 range, we will see a profit on the short strangle. If the stock closes at $100/share on expiration, we will realize our max profit of $10. 

On the other hand, if we thought the stock was going to move a lot, we would instead buy a straddle. For a long straddle purchased for $10 on this stock, we would need the stock to go outside this range (above 110 or below 90) in order to break-even and realize a profit. When you buy a straddle, there is no cap on your profit, as the stock could in theory go to infinity. When you sell a straddle, your profit is limited to the credit received.

Let’s take a look at a real-world example of a straddle now on Smith & Wesson (SWBI), which will release earnings later this week.

SWBI Straddle

We can see from the image above that the front-month straddle for SWBI (consisting of both the June 18th 20 strike price call and put) is trading at $1.50 ($1 + $0.50 going off the mid prices). Since the stock is trading higher than 20 at 20.48, this straddle will not be precise. But since it is not earnings season and pickings are slim, we will have to live with it. This means that the stock of SWBI is expected to move by approximately $1.50 post-earnings, which is tomorrow. 

If you were to buy this straddle for $1.50, you would need the to stock to either: a) rise to $21.50/share or b) fall to $18.50/ share in order to break even on our straddle. Beyond those parameters is increasing profit.

If you were instead to sell this straddle, your max profit would occur if the stock closes at $20 on expiration post-earnings. In this instance, you would collect the full premium of $1.50. Your max loss would in theory be infinite since there is no cap on how high a stock can go. 

Options Strategies for Earnings

Though the straddle is a great strategy to gauge in theory where a stock may move post-earnings, in practice, straddles are one of the riskiest options trading strategies. 

If you sell a straddle, your max loss is infinite. When you buy a straddle, not only is it going to cost you a lot of money, but you will need the stock to make a very large move just to break-even. 

But just because we don’t want to take on the risk that comes with trading straddles doesn’t mean we can’t get in on the earnings action. Let’s take a look at a few options strategies with limited loss potential to utilize during earnings season, beginning with the short iron condor.

1) Iron Condor

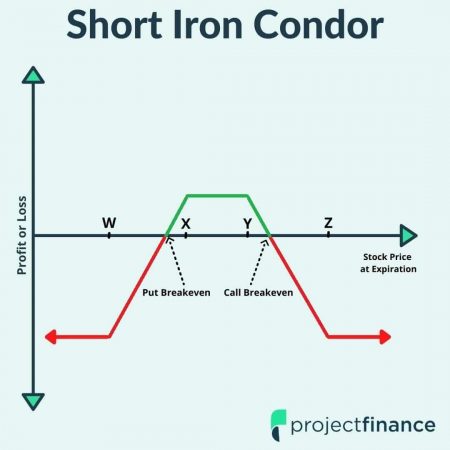
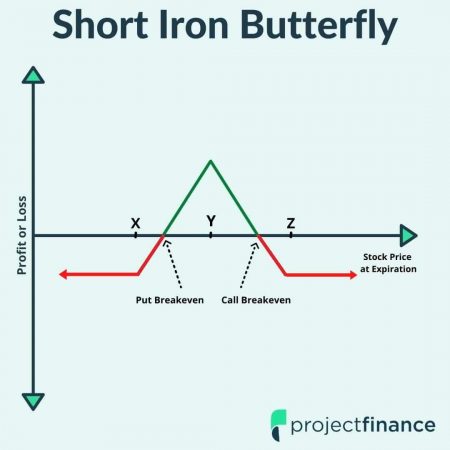
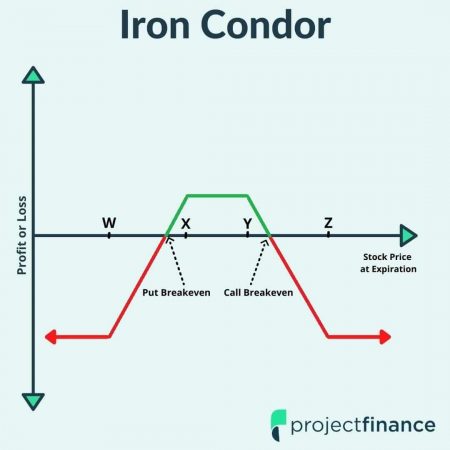
The iron condor is a great earnings play options strategy. You can either buy or sell an iron condor. The below graph represents a short iron condor, which is the more popular way to trade earnings. 

  • The seller of an iron condor is market neutral and expects the stock will remain within the bounds of the two options (call and put) that are sold. These trades are thus considered market neutral.
  • The buyer of an iron condor is directional and believes the stock will either increase or decrease in price beyond the bounds of the two options (call and put) purchased.
Short Iron Condor

The iron condor is very similar to the strangle strategy. A strangle consists of buying (or selling) a call and a put option with different strike prices, but with the same expiration date. The only difference is with the iron condor, we have purchased options to help hedge our risk. 

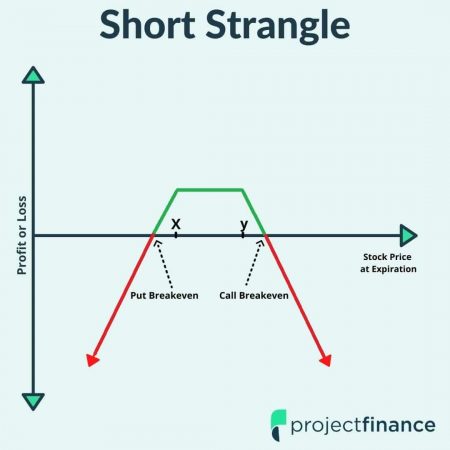
A chart for a short strangle would be very similar to the chart of the short iron condor above. With an iron condor, the loss levels out at the strike price of our options purchased. For a strangle, these red arrows continue to go down. Take a look at how a short strangle looks below. 

Short strangle chart

It is because of this risk that most beginner traders are better off trading iron condors. 

If you’d like to learn more about both the long and short iron condor strategy, watch our videos below.

Iron Condors Explained

2) Iron Butterfly

The iron butterfly is another great defined-risk options strategy to use during earnings. If the iron condor is a great risk-defined strategy when compared to the strangle, then the iron butterfly is a great risk-defined alternative to the straddle, which we talked about earlier as a measurement of expected move

You can both buy and sell iron butterflies:

  •  The seller of an iron butterfly is market neutral and believes the stock will stay within a specific range.
  •  The buyer of an iron butterfly is directional and expects a significant stock move in either direction
Short Iron Butterfly Graph

A short iron butterfly is popular for options trading earning plays because it takes advantage of the elevated volatility. This strategy can be thought of as simply a short straddle with an added long strangle for protection. Additionally, a short iron condor can be thought of as an iron condor where the short call and short put options are of the same strike.

A downside of selling an iron butterfly (and iron condor) is that you will not collect the full amount of the expected move because you are buying long options against the short straddle (or strangle for the iron condor).

For more insight into both the long and the short iron butterfly, check out our videos below.

Iron Butterfly's Explained

Locking in Profits

Sometimes, it is possible to lock in profits early on earnings plays. Here are two methods of how to do this.

1. Trade Out Pre-Earnings

Though incredibly risky, and often compared to gambling, trading options pre-earnings reports can provide some advantages to options traders. One advantage is what I like to call the “free look”. 

Let’s say you think a stock is going to make a big move post earning later today after they are released. You decide to purchase a straddle right after the market opens.

Stocks are notoriously volatile in the days and hours leading up to an earnings report. If shortly after you put this trade on the stock rallies hard and fast, you could trade out of the position and lock in a profit and not even have to worry about what the earnings are. 

On the other hand, if the stock doesn’t move at all, you can simply wait and hope for what you originally intended – a big swing post-earnings.

Another way to lock in options profits on earnings plays is by buying or selling shares of the underlying stock. Let’s see how that works next.

2. Stock Hedge: Amazon (AMZN) Example

Let’s say you bought a straddle on AMZN at the 2,000 strike price for $50 just before the earnings report came out. You need the stock to rise to $2,050 (for the call) or $1,950 (for the put) in order to break even.

On the immediate tail of their earnings, we’ll say AMZN rallied all the way to $2,200/share. Since you paid $50 for this straddle, you just made $150 on the trade. Not bad!

But who knows where AMZN will be trading tomorrow when the options markets open again?  In theory, you could hedge the profits on the long call part of your straddle by selling the stock in the after-hours market for $2,200. The downside of this, of course, is you need the capital to hold 100 shares of stock. Do you have $220k laying around? Probably not. Sometimes, your broker will work with you here, but most of the time, you’ll be on your own. 

It can therefore be wise to trade options on stocks that you can afford to hedge.

Conclusion

Trading options going into earnings is very risky and the equivalent of gambling. That being said, a lot of money can be made…and lost. The most important thing to understand when placing a trade before an earnings report is risk. Know your risk!

Know too that the stock may not react the way you think it will. Many times, after a few swings, a stock settles right back to where it started. 

It is because of this that most professional traders prefer to sell option premium going into earnings. This non-directional bet is known as being “market neutral”. If you’d like to learn a few more market-neutral strategies, feel free to check out our article, “5 Options Strategies for a Sideways Market”.

Happy trading.
5 High Dividend, Low Volatility ETFs

In the stock market, peace of mind is hard to come by these days. 2022 is shaping up to be an even more volatile year that last year. 

For investors who have had enough of the volatile swings, it would be nice to have a portion of your portfolio a.) receiving dividend income no matter what happens in the market and, b.) invested in a few stocks that don’t make your heart drop or race every time you check your account balance. 

Before we get into the 5 pics, let’s take a moment to examine why high dividend, low volatility exchange-traded funds (ETFs) make sense.

Low Volatility ETFs/Stocks

A time-old expression regarding money states that higher risk = higher return. If the “low volatility anomaly” is correct, this adage may be broken, at least in the US stock market. The research behind this anomaly argues that low volatility stocks actually outperform their higher-beta peers over large periods of time. Sounds counterintuitive right? Maybe like something the most boring guy in the pub might say after a few beers? 

That may be, but the low volatility anomaly theory has actually been proven

Let’s take a look at a few reasons to explain why this anomaly exists.

1. Investors Are Irrational

Believing high beta stocks will vastly outperform more boring, low beta stocks, market participants often ignore the fundamentals and overpay for popular stocks. Just think about Tesla (TSLA) or Gamestop (GME) here. When these equities correct themselves, the buyer will never get back that heavy premium they paid to buy-in. Meanwhile, the turtle has passed the hare.

2. The Margin Factor

Many investors don’t have access to margin. They believe investing in riskier assets will pay off to make up for this lack of margin. Over time, these buyers also inflate the premium of risk heavy equities. 

3. Limit to Arbitrage

So since this anomaly exists, why don’t market participants expose this irrational risk demand to turn a profit? Perhaps they would, but large portfolio managers have a benchmark, or a mandate to beat, and these benchmarks (such as the S&P 500) are frequently weighted heavily by very volatile equities.

High Divided Paying ETFs/ Stocks

So now we know why low volatility stocks are great, what about dividend-paying stocks? Well, aside from the obvious dividend, they too outperform! 

Morgan Stanley has proven that from 1991 to 2015, dividend-paying stocks had an average annual return of 9.7%. Compare that to non-dividend paying stocks, which earned only 4.18% during the same period. Did your world just get blown?

But we’re not concerned about just stocks; we’re interested in what happens when the best ones get together and form a family. Without further ado, here are projectfinances 5 great high dividend, low volatility ETFs.

1. Legg Mason Low Volatility High Div ETF - LVHD

Legg Mason’s Low Volatility High Dividend ETF is a great choice for truly risk-conscious investors. Why? Not only do the stocks within this fund meet the criteria to be on this list, but they are also diversified across numerous asset class categories. 

In today’s increasingly diverging markets, it is important to have exposure to everything. Just think about what tech stocks did early on in the pandemic, and how later, when the reopening was being staged, industries left them in the dust. 

If you were in the wrong sectors during this time, your portfolio definitely felt the hit. The LVHD ETF uses the Russell 3000 as its benchmark, which represents 98% of the public equity market in the US. However, the LVHD ETF currently only has 80 equities within it. The fund picks and chooses across the market cap spectrum only those stocks that meet their criteria; fat dividends and low risk.

The dividend yield of LVHD is also the highest on our list, coming in at an eye-opening 2.93% yield. The fees are also minuscule, with the average ETF fee hovering around 0.40%, LVHD crushes it with their low 0.27% expense ratio.

For the low volatility-seeking investor, LVHD could quite literally pay off some very nice dividends down the road.

LVHD Top Holdings

Consumer Staples: 23.51 %

Real Estate: 14.12 %

Utilities: 14.03 %

Health Care: 13.41 %

Industrials: 13.37%

2. ProShares Russell 2000 Dividend Growers- SMDV

Next on our list is ProShares Russell 2000 Dividend Growers ETF, SMDV. This ETF focuses on high dividend-paying stocks within the small-cap category. ProShares is very strict as to what companies get invited to be on their list: not only do the companies within this fund currently pay dividends, but they all have been doing so for at least the past 10 consecutive years. 

Such companies with a track record of dividend-paying more often than not are more stable than their more volatile small-cap peers. 

Another reason investing in SMDV may be a good idea for the low volatility-seeking investor is its low beta of 0.80 percent. Comparatively, The beta of IWM, one of the most popular ETFs in the small-cap space, is 1.27. 

For the investor looking for low volatility exposure to the small-cap market, SMDV appears to be a great option.

SMDV Top Holdings

Financial Services: 25.16%

Utilities: 23.32 %

Industrials: 21.49% 

Basic Materials: 7.95%

Consumer Defensive: 7.89%

3. Invesco S&P 500® Low Volatility ETF - SPLV

Invesco’s S&P 500 Low Volatility ETF, SPLV, is a great way for investors to get exposure to 1) the best capitalized, and 2) the least volatile companies in the US. This fund attempts to mirror that of the S&P 500 Low Volatility Index, which is a weighted index that ranks the companies within it by their volatility. The less volatile a firm is, the higher its weighting within the index. 

The S&P Low Volatility Index has within it 100 stocks, all falling under the large-cap or mid-cap category (with the former outweighing the latter). The SPVL ETF currently has 103 stocks within it, making the ETF slightly more expansive than the index.

Just like the index, SPLV rebalances its holdings quarterly, which helps to keep up with the perennially shifting volatility in today’s markets. 

Worth mentioning too is the fund’s low beta of .70, as well as its modest expense ratio of 0.25%. For more specialized funds like SPLV, that fee isn’t too bad at all.

SPLV Top Holdings

Consumer Staples: 22.85%

Utilities: 15.81 %

Health Care: 14.74%

Industrials: 12.48%

Financials: 9.69%

4. iShares MSCI Emerging Markets Min Vol Factor - EEMV

The iShares MSCI Emerg Mkts Min Vol Fctr ETF EEMV takes the pic for top emerging markets low volatility, high dividend ETF. This ETF tracks the MSCI Emerging Markets Minimum Volatility (USD) Index.

The investor seeking safety may be tempted to avoid emerging markets altogether, but to be truly safe you must be truly diversified, and to be truly diversified you must have exposure to all different kinds of equities, including those of emerging markets. 

There are two big reasons this ETF is on our list. The first is the exceptionally high dividend yield of 2.31%. Most investors don’t associate emerging markets with high dividends, but that is exactly the case here. 

The second reason is the fund’s low beta of 0.74%, which may help to bring a few volatility-burnt investors onboard. When compared to the volatile history of the MSCI Emerging Markets Index, EEMV has fared quite well. According to Morningstar, the volatility of EEMV was 24% lower than the MSCI Emerging Markets Index from its launch in 2011 through June of 2020. That’s impressive. 

Fees are also exceptionally low for EEMV; the expense ratio is a meager 0.25%. Perhaps this is due in part to the fund’s low semiannual turnover cap of 10%. Lastly, EEMV has a healthy diversification across market sectors. Take a look at a few below.

EEMV Top Holdings

Financials: 19.90%

Communication: 16.63%

Information Technology: 15.16%

Consumer Discretionary: 11.69%

Consumer Staples: 10.60

5. Invesco S&P MidCap Low Volatility ETF - XMLV

The last fund on our list tackles the mid-cap sector. Invesco’s XMLV is a great way for the risk-averse investor to get relatively low volatility exposure to this sector. 

Worth mentioning is the heavy-weight XMLV presently places on the real estate sector. Their 18.69% exposure to real estate stands in stark contrast to the S&P 400 index, which currently has a weight of only 9.5% in this sector.

Though traditionally more stable than equities, the real estate sector is known for its incredibly volatile swings. Many of today’s Real Estate ETFs weren’t in existence during the financial crisis of 2007-2008. One fund that was around during this time was iShares U.S. Real Estate ETF (IYR). Take a look at this image to see how the iShares IYR fund fared during the volatile years of 2007-2008. Not well. 

As long as you can stomach the heavy real estate sector weight, IYR seems to be a great option for both a fat dividend and low volatility in the mid-cap sector.

XMLV Top Holdings

Industrials: 18.69%

Real Estate: 17.25%

Material: 12.67%

Utilities: 12.66%

Financials: 9.24%

5 Option Strategies for a Sideways Market

5 Option Strategies for a Sideways Market

One of the greatest advantages of options is the great versatility that they offer. With stock trading, you are betting on a binary outcome; the stock is either going to go up or down. Options trading, on the other hand, is custom-tailored.

Analysts can’t make up their mind about where the market is headed in 2022 . Often times, this results in a stagnating market. 

If a stock is trading at $100 a share, you can utilize an option strategy to capitalize on pretty much any future price of that stock, for whatever date you desire. Think that $100 stock is going to soar past $105 post-earnings? You can buy a 105 call. What about if you’re not sure what the earnings will be, but you want to capitalize on a large up or down movement? Here, a long straddle (long call & long put) would make sense. 

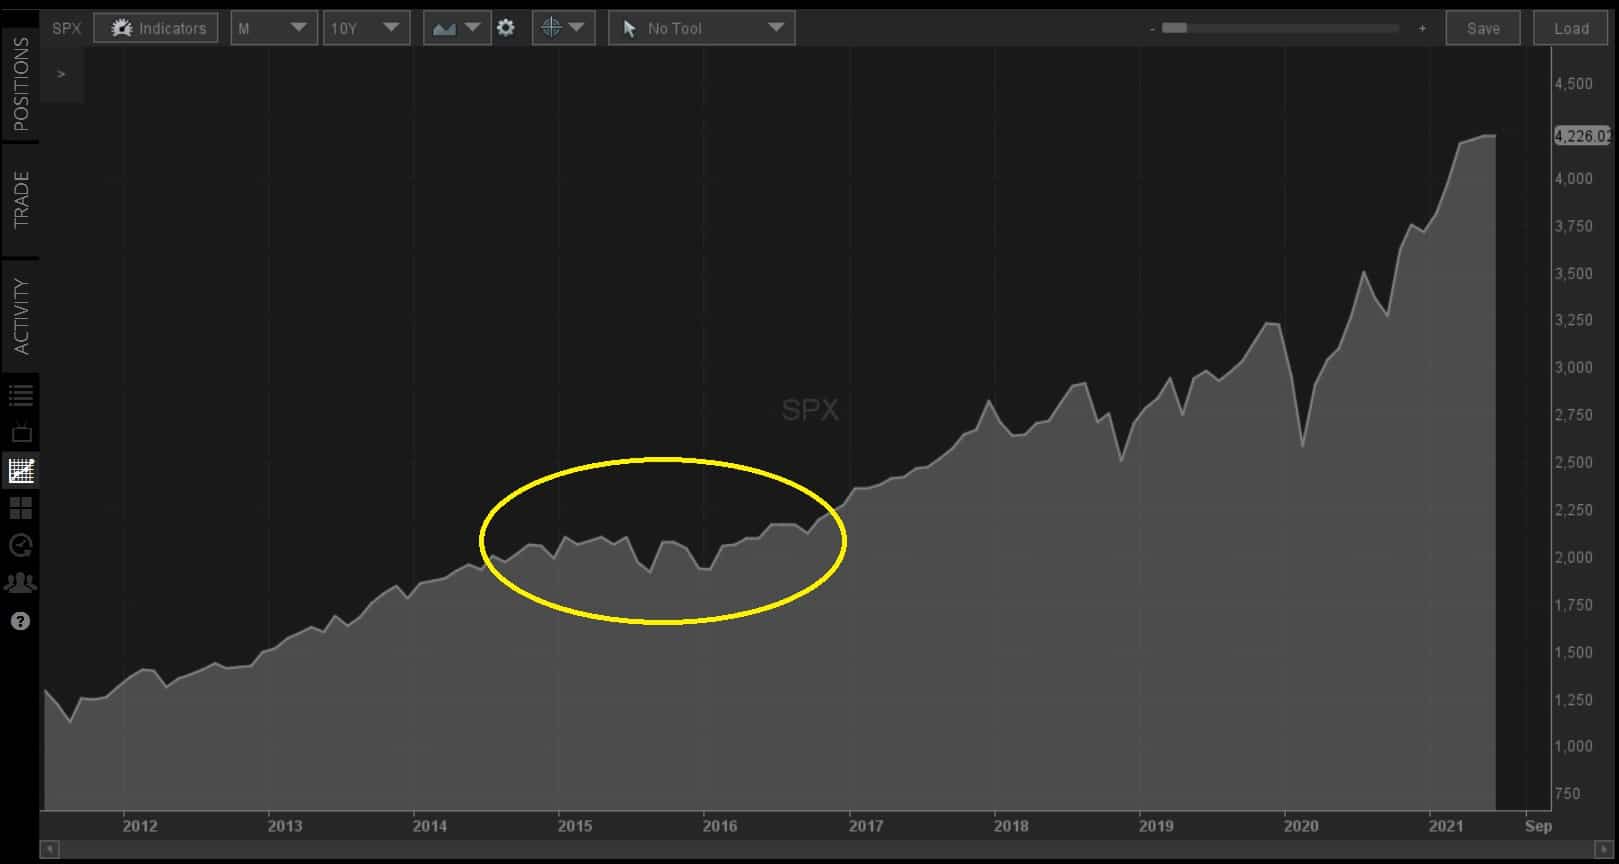
But what if you think a particular stock or index isn’t going to go anywhere at all? All traders will eventually find themselves in the doldrums of a market. Sometimes this stagnation period lasts for weeks, other times it can last for years. 

Take a look at the below 10-year chart of SPX (S&P 500) on the tastyworks trading platform:

Market Neutral Advantage

If you were long or short during this period, you probably didn’t make or lose a lot of money. If you were market neutral (sometimes called “delta neutral”) on the other hand, your profitability would have clipped past those directional schooners at an impressive rate. 

So let’s assume we are in a directionless market and you want to capitalize on this trend. Where do you begin? For beginner options traders, sometimes the most difficult decision to make is determining what option strategy to use. There are dozens of different template option strategies, and these don’t even count the innumerable “custom” strategies you can create on your own. 

All of our below option trading strategies profit by something called “time decay (theta)”, or theta. Theta is one of the option Greeks. Over time, assuming all other variables stay the same (stock price, volatility) the premium of options goes down in value. This “theta”, as it is known, allows for all market-neutral strategies to profit. We are (for the most part) selling options, or, have “net credit” positions. 

Now let’s jump right into it. Here are projectfinance’s top 5 strategies for a sideways market.

1. Short Iron Condor

Direction: Very neutral

Risk: Defined risk, low risk

IC Final w Strikes

Position

  • Short call spread YZ
  • Short put spread WX

Max Profit

Total credit received from both call spread YZ and put spread WX

Max Loss

Strike price width (same width for calls and puts) minus the total credit received

Breakeven

Downside: Short put strike X (minus) total premium received

Upside: Short call strike Y (plus) total premium received

The short iron condor is a great strategy for beginner options traders. It is a complex strategy, yet at the same time very intuitive and easy to understand. 

Before placing your first iron condor trade, it is important to have a working understanding of how vertical credit spreads work. After you’ve mastered these concepts, the iron condor should be a cinch. Let’s get right into it. 

An iron condor is simply the marriage of a call and put vertical spread on the same stock, of the same expiration, and of the same width. Since we are market neutral, both the call and the put spread we sell must be out of the money. To gain a better understanding of how this works, take a few moments to examine the chart under the heading of this section. 

Long legs limit loss

The W and X points represent the strike prices of the two puts you sold, while the Y and Z points represent the two call strike prices. We can see the position makes the most money when the stock stays between X and Y, these being our short strikes.  

The iron condor is one of the purest market-neutral plays for the risk-averse investor. Notice how the two red arrows at the bottom of the chart level off? That is our long call (on the right) and long put (on the left) coming in to save the day should the underlying skyrocket or plummet in value.

Though these two positions act as a great hedge for our short, the long call and put component of the iron condor also limit us from additional gain. What would happen if we didn’t buy them? Let’s take a look next at the short straddle and strangle strategies, which have very similar risk profiles.

2. Short Strangle

Direction: Very neutral

Risk: Undefined risk, HIGH risk

Short strangle chart

Position

  • Short call option Y
  • Short put option X

Max Profit

Total credit received from both call and put option

Max Loss

Unlimited (in theory, the stock could go to infinity, thus our short call loss potential is infinite)

Breakeven

Downside: Short put strike X (minus) total premium received

Upside: Short call strike Y (plus) total premium received

The short strangle involves selling both a call (Y) and put option (X) on the same underlying stock/index of the same expiration. For a market-neutral position, both the call and the put will be out of the money. 

The aim of the short strangle is that by expiration, the stock will be trading between the two strike prices sold.

You may notice a strong resemblance between the short strangle chart above and the previous iron condor chart. They are very similar indeed, with one incredibly important difference: your long call and long put aren’t there to save you this time should the stock/index burst outside your strikes. 

This is a very risky strategy. I enjoy a good night’s sleep, so, therefore, have never had the courage to place a short strangle trade. Not only do you have unlimited risk on the upside, but the stock could also in theory go to zero, giving you an incredible downside loss potential as well. 

There is only one strategy that is more market neutral than the short strangle, and that is the short straddle. With this option strategy (when sold at the money), you are betting that the stock/index isn’t going to move one bit. Let’s take a look at the straddle next. 

3. Short Straddle

Direction: Incredibly neutral

Risk: Undefined risk, as risky as it gets

Short Straddle Chart

Position

  • Short call option Y
  • Short put option X

Max Profit

Total credit received from both call and put option

Max Loss

Unlimited (in theory, the stock could go to infinity, thus our short call loss potential is infinite)

Breakeven

Downside: Short put strike X (minus) total premium received

Upside: Short call strike Y (plus) total premium received

The short straddle is an option strategy used by traders who hope to pin the future value of a stock/index to one particular strike at a particular expiration. Like the strangle, the straddle involves selling a call and a put on the same underlying and of the same expiration. Unlike the strangle, the straddle strike prices aren’t different but are exactly the same (XY). 

If the short strangle had a great similarity to the iron condor, then the straddle has an uncanny resemblance to the straddle (listed above). Take a moment to study the chart above with your strike prices XY.

More Gambling than Investing

I like to compare the short straddle to a roulette wheel. You pick a number (the strike price of both your call and put) and if the ball lands on that number when the ball stops spinning (expiration), it’s winner winner chicken dinner. The ball doesn’t necessarily have to land on your strike price by expiration to realize a profit, as long as the premium received covers the width, you’ll profit. 

For example, let’s say AAPL is trading at $125/share. You think that in one month from today, AAPL is going to be trading right where it is today. You sell a call and a put of the same strike price for this expiration (a straddle) and collect a total premium of $5. That $5 premium gives us a bit of room; our breakeven is now $5 to the upside and downside, or between $120 and $130 a share. 

But when the stock breaks outside those levels, watch out. Just like in the strangle, the short call gives us unlimited loss potential here, and the short put risk is substantial as well (all stocks can go to zero). 

It is because of this immense possible loss that short strangles are reserved only for the very experienced trader. Let’s next take a look at a far less risky option.

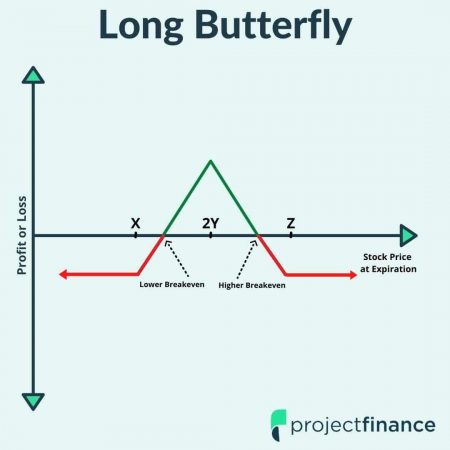
4. Long butterfly

Direction: Very neutral

Risk: Defined risk, low risk

Long Butterfly FINAL (2)

Position

  • Long one in-the-money call X
  • Short two at-the-money calls 2Y
  • Long one out-of-the-money call Z

Max Profit

Middle strike price Y (minus) lowest strike price X (minus) trade premium

Max Loss

Premium paid

Breakeven

Downside: Lowest strike X (plus) position premium

Upside: Highest strike Z price (minus) position premium

The long butterfly options strategy in the example above consists of both a long call vertical spread and a short call vertical spread of the same expiration and of equal width. The short options on these spreads must converge at strike price Y. The aim of this strategy is to profit from a neutral stock price that hovers near this short (center) strike.

Butterflies are like straddles in that in order to achieve maximum profit, the stock must expire at a very specific price (Y). Butterflies are unlike straddles in that they have defined risk. You will never lose more than the debit paid. 

The long butterfly strategy will consist of either all calls or all puts. This example focuses on long calls, but the risk-reward profile will be identical for long puts. 

5. Covered Call

Direction: Neutral to slightly bullish

Risk: Defined risk, low risk (the risk is on the stock side)

Covered Call Graph

Position

  • Long 100 shares of stock
  • Short one call option (X)

Max Profit

Short call strike X (minus) stock purchase price (plus) premium received.

Max Loss

Purchase price of stock (minus) credit received from selling call X

Breakeven

Stock purchase price (minus) call premium

The last pic on our market-neutral list is the covered call. This options strategy is a financial transaction that involves the combined position of 1.) long 100 shares of stock, and 2.) one short call. 

Writing a covered call is a great way for investors to make a little extra income on their stock in a sideways market. While the other strategies on this list are speculative in nature, the covered call is a risk-averse position because it actually reduces losses on the long stock owned. 

Why? If we didn’t have a short call, we would lose 1:1 for every penny the stock goes down in value. When you add the premium collected from a short call, your stock won’t start losing money until it falls beyond that extra premium we collected.

For example, if a stock is trading at $135, and we sell a $140 call for a premium of $2, the stock can fall all the way to $133 before we see a loss. 

This is why the covered call is a great strategy to make extra money off your stock in a neutral market. However, if the market begins to rally past that short call we sold, our upside potential will be pinned to the strike price of that call (plus) premium sold.

Conclusion

Market neutral positions can be very profitable when the underlying stock/index stays within our range. That being said, many of these positions require non-stop attention and diligence. If you’re of the “never risk more than you can lose” mindset, the undefined risk strategies on our list will not be for you.

Happy trading. 
Next Lessons

5 Altcoin Investments in 2022

Horse Race

Altcoins: Proceed With Caution

Is diversification in the crypto space as important as diversification in the stock market? In theory, it sounds like a good idea. That being said, it isn’t common for equities to skyrocket and plunge over 20% on a daily basis as many cryptos do, including Bitcoin. 

In addition to cryptos’ wild swings, investors should also take note that more than half of the Top 100 Cryptos have no utility! In other words, other than a store of value (not unlike used Nike sneakers), most cryptos have no working value. Zilch. 

Nobody knows what the future holds for cryptocurrencies. To put a case for cryptos into perspective, let’s examine them through the lens of two potentially ticking time bombs: modern fiscal and monetary policy.

The total global debt number currently sits at 280 trillion. In the US alone, the per capita (per person) debt equates to over 85k. It doesn’t matter if you’ve balanced your checkbook, paid off all of your credit cards, and own your house outright. Compliments of the US government, you’re still in debt over 85k. That’s what happens when short-term politicians set long-term fiscal policy. 

   Highlights

  • Mounting US debt could devalue the US  dollar, giving an upside advantage to cryptos.
  • There are numerous coins aside from bitcoin that provide real-world utility. 
  • Ethereum, Cardano, Litecoin and Stellar Lumens are all speculative investments with potential upside.
  • Stable coins are pegged to the price of a fiat currency, usually the US Dollar.
  • Interest rates on stable coins offer investors higher returns than typical banks.

Inflation and Cryptocurrencies

So what does this debt have to do with cryptocurrency? When a government issues excess debt, the demand for that debt naturally goes down. This lower demand causes inflation, and inflation causes the value of fiat currencies (US Dollar, Mexican Peso, etc.) to decrease in value. 

In other words, your money in the bank will be worth less than it was, thus decreasing your purchasing power. In the old, old days of 2016, this scenario would have been a great catalyst for a surge in gold, but gold has been losing some of its thunder lately to cryptocurrencies. 

Runaway inflation may happen in the coming years, but if history repeats itself, it probably won’t be as severe as me and other doomsayers believe it will be. Even if inflation does sweep through the US economy, who is to say the value of cryptos won’t crash with everything else? There has been an increasing corollary between bitcoin and the Nasdaq recently.

Are cryptocurrencies a safe and viable alternative to the US dollar? In the long run, who knows. It’s the wild west out there folks. 

Bitcoin has been on a tear, and the entire world is eager to invest in bitcoin ETFs, but these ETFs are trading at a high premium (and pose risks to investors). We made a list of some Bitcoin alternatives for those looking to diversify their crypto holdings, as well as those who can’t seem to get over their FOMO (fear of missing out) from the latest crypto run. 

Here are a few of the wild mustangs that may or may not compete with Bitcoin, just in case you missed that stallion.

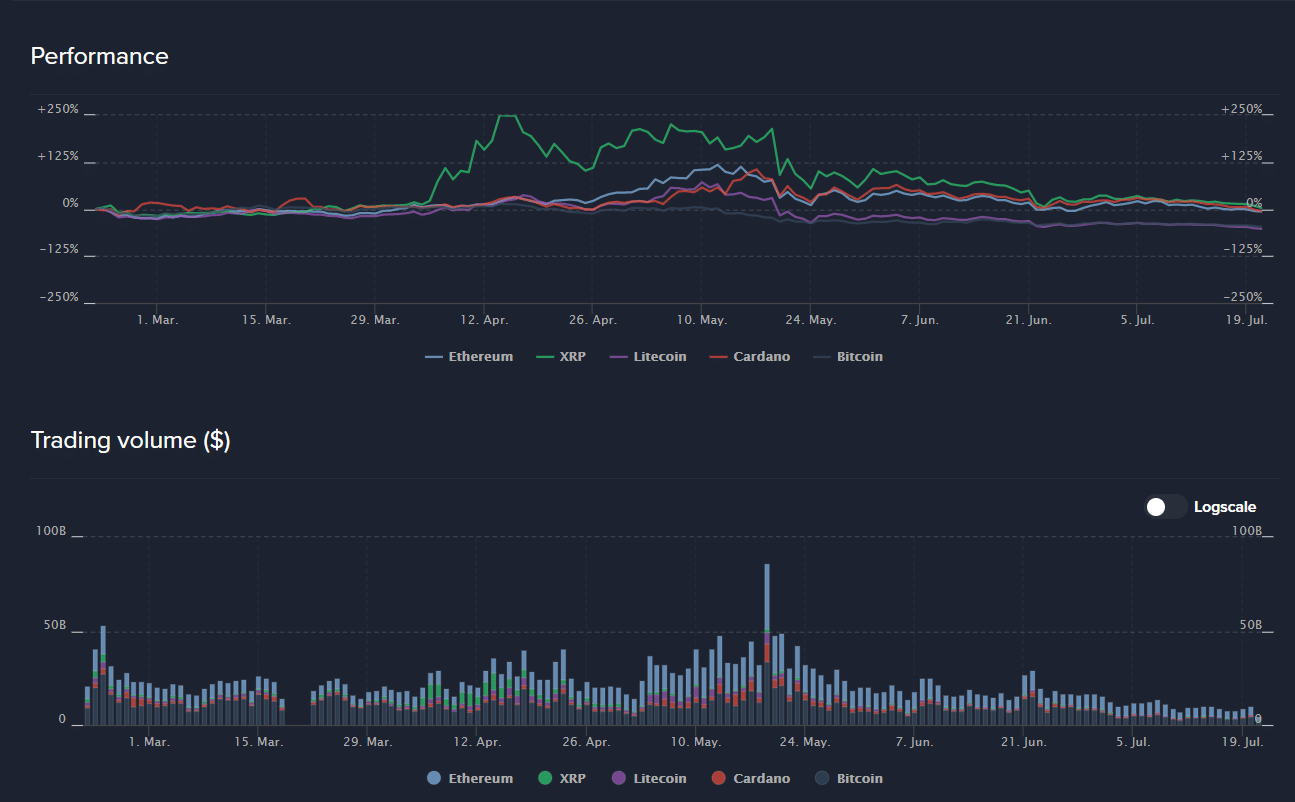
5 Month Performance of Alernative Cryptos

Chart created from https://coinlib.io/

1. Ethereum (ETH)

Market Cap: $323 billion

System: proof of work (PoW)

Before the second half of 2021, Bitcoin never truly had a worthy contender. That all changed recently when the limelight was suddenly shining on Ethereum.  

Mark Cuban has compared Etherum not to Bitcoin, but the internet because of its network-like characteristics. While Bitcoin acts simply as a peer-to-peer network cash system, Ethereum is trying to become a currency that also serves as a working infrastructure. 

When Russian-Canadian programmer Vitalik Buterin created Ethereum in 2013, he had in mind Bitcoin’s minimal utility. He intended to create a coin that complemented Bitcoin; he ended up creating Bitcoin’s most viable competitor. 

In an interview with Business Insider, Buterin compared Bitcoin to a pocket calculator and Ethereum to a multi-functioning smartphone. He believes that increasing the power of a currency makes it more general purpose. 

In addition to Ethereum’s platform-like utility, it is also faster than Bitcoin. If you think Etherum is the way of the future, you won’t be alone; companies like Mastercard and JP Morgan are pouring money into ConsenSys, which is building Ethereum blockchain infrastructure. 

Here are a few reasons that Ethereum made the number one spot on our list:

◉ Utility

Ethereum has applications beyond the ether token; the vast majority of NFTs are part of the Ethereum blockchain.

◉ Improving Energy Efficiency

Though already more energy-efficient than Bitcoin, Ethereum has plans to cut its energy consumption by 99%!

◉ Smart Contracts

Ethereum uses “smart contracts” to replace intermediaries, which increases the speed and efficiency of transactions.

2. Cardano (ADA)

Market Cap: $55 billion

System: proof of stake (PoS)

Cardano Coin

After stagnating for a few years, the environment-friendly Cardano recently came screaming back to life. With a market cap of over 58 billion, it has now dwarfed that of Litecoin, which currently has a market cap of only 13 billion. Let’s examine why.

In a recent interview with Forbes, the founder of Cardano, Charles Hoskinson, recently stated Cardano was 1.6 million times more energy-efficient than Bitcoin. On the tail of Elon Musk’s anti-Bitcoin tweet (Musk was concerned about fossil fuels being used to mine for Bitcoins), investors went scrambling for energy-efficient alternatives and found Cardano. 

The price of Cardano soon climbed to over $2, an all-time high for the coin. Although this search for energy-efficient coins put Cardano in the public spotlight, it was outperforming before even then. Let’s take a look at a few of Cardano’s compelling characteristics to find out why.

◉ Hard fork combinator

This Cardano feature allows for more seamless forks. The combinator feature will be of particular interest to those who watched the now infamous Bitcoin fork of 2017.

◉ Proof of State Technology

Compared to proof-of-work technology (like that of Bitcoin), proof-of-state technology does not incentivize extreme energy consumption.

◉ Existing real-world application

Cardano has already proved its functioning utility with pre-existing relationships with developing nations such as Georgia.

3. Litecoin (LTC)

Market Cap: $12 billion

System: proof of work (PoW)

Litecoin Image

Photo by Executium on Unsplash

Litecoin is a commonly mentioned name in the Crypto world, and a relative dinosaur compared to all the new burgeoning coins. Today, the wildly popular cryptocurrency exchange platform Coinbase offers over 25 currencies. A few years ago, the exchange only offered a few, one of which was Litecoin. 

Litecoin, a peer-to-peer coin, was created in 2011 by former Google employee Charlie Lee as a spinoff to Bitcoin. Lee made headlines in 2017 when he sold and donated all of his Litecoin to charity (such charitable minds seem to be more common in the crypto space when compared to traditional banks – hmmm).

Technically speaking, Litecoin is nearly indistinguishable from Bitcoin. Here are three of the very few advantageous reasons to choose Litecoin over Bitcoin.

◉ Speed

Litecoin aims to process a block in 2.5 minutes. This is faster than Bitcoins average of 10 minutes.

◉ Script Algorithm

Litecoin’s usage of Script in its proof-of-work algorithm may ultimately result in making the coin more accessible to users when compared to Bitcoin’s more antiquated SHA-256 algorithm.

◉ Market Cap

Bitcoin’s market cap currently sits at 958 billion. In contrast, Litecoin’s market cap is currently under 12 billion. Considering the similarities of these two currencies, and Litecoin even beating Bitcoin on a few levels (such as Script), Litecoin may have some catching up to do. 

4. Stellar Lumens (XLM)

Market Cap: $8.8 billion

System: open source software

The fourth coin on our list was a toss-up between Stellar Lumens (XLM) and Ripple (XRP). We have tried to focus on coins that actually provide real-world utility in this post, and both of these coins aim to facilitate low-cost, cross-border transactions. Stellar won here, mainly because it doesn’t have a massive SEC lawsuit pending

Transactions conducted on the Stellar open blockchain network platform use their own native coin, Lumens – XLP. Because of its low-cost and global-friendly infrastructure, Stellar has been attracting a lot of attention in the financial institution space. If you were a bank sending/receiving a few billion, would you rather that transaction be done immediately at minimal cost, or over the course of a few days with high fees? Stellar allows for the former.

Stellar is also an attractive alternative to those more green-minded – unlike Bitcoin, with Stellar, no coins are actually mined. This means very little energy is required to run the software. 

Perhaps the reason for Stellar’s similarity to Ripple is that its founder, Jed McCaleb was a founding member of Ripple Laps. Let’s take a look at a few reasons why Jed’s product may be advantageous to have in your portfolio.

◉ Real-world value

Unlike the vast majority of altcoins, Stellar has proven its utility. Over time, the usage of cryptocurrency will most likely increase. Stellar is positioned well for future growth in the high-stakes corporate space.

◉ No pending lawsuit

Nobody knows what the repercussions of the pending Ripple lawsuit will have on XRP. Since Stellar Lumens is almost identical to XRP, market share may very well drift in its direction should the SEC rule unfavorably.

◉ Accessibility

Some of the more exotic altcoins are difficult to trade, forcing would-be buyers to go through complex and time-consuming affairs just to get access. The Stellars XLM coin is available to trade on most exchanges. This allows for greater market access.

5. US Dollar Stable Coin with BlockFi (USDC)

Market Cap: $23 billion

System: Interest-bearing acount

The last coin on our list isn’t particularly a coin at all, but the interest that can potentially be made on coins. BlockFi treats your coins in the same fashion banks treat your cash; by paying interest. 

BlockFi is currently paying out eye-opening APY interest rates on several cryptocurrencies held with them, including Bitcoin and Ethereum. For some coins, the rate you receive depends on the amount of coin you have with them, e.g, if you own 5 Ethereum coins held with BlockFi, you would receive a 1.5% APY interest rate with them. Not bad! How can they afford to do this? Like banks, BlockFi is also in the business of lending money, and they do this at rates far higher than the rates they are paying us, the lenders. 

But it isn’t Bitcoin or other currencies that made the number 5 spot on our list, it’s the USDC (US Dollar Coin) held specifically at BlockFi. Why? Right now, BlockFi is paying an interest rate of 9% APY for USDC held with them. That’s incredible! So, what’s USDC?

Stablecoins

USDC is a stablecoin. Stablecoins are pegged to the market value of a currency or commodity. The USDC is pegged to (you guessed it) the US Dollar. This makes for a far less volatile coin. The current USDC price is therefore $1, as you would suspect. 

With the best traditional saving account rates on the market currently paying around 0.05% interest, BlockFi’s return is exponentially better.

If you’re interested in opening an account with BlockFi, projectfinance has an affiliate program with them where you can get up to $250 in free bitcoin for depositing funds into one of the two stable coins they offer, both of which pay over 7% in interest. 

However, this high interest rate comes not without risk. Your money in the bank comes with a 250k FDIC (Federal Deposit Insurance Corporation) insurance policy from Uncle Sam should that bank go belly-up. BlockFi? Not so much. This is assuming the worst-case scenario, and with crypto, you always have to keep that in mind.

Runner Up Altcoins

  • Bitcoin Cash (BCH)
  • Polkadot (PKD)
  • Monero (XMR)

Conclusion

There are over 4,000 different Cryptocurrencies in existence. Investing in any of these coins is a risk, no matter how you look at it. Who’s to say next year a far superior coin won’t be created, making all the Bitcoin and Ethereum of the world dinosaurs? What will it be? Peaches and Cream coin? Dalmatian Coin? Who knows. 

That being said, crypto does seem at the moment to be a viable hedge against the mounting debt and nascent inflation mentioned at the beginning of this article. Just remember, never invest more than you’re willing to lose. Invest small, lose small.

*Notable and very deliberate exclusion: Dogecoin (DOGE)

Happy trading.
Option Traders Glossary: Definitions and Terms

Option Traders Glossary: Definitions and Terms

Glossary

Moneyness, time decay, assignment…what does it all mean? projectfinance created a glossary of elementary option trading terms so you’ll always have them close at hand. If you want to learn all the basics of options trading, be sure to check out our video below. Enjoy!

Options Trading for Beginners

Call Option

Long Call

In options trading, a call option (call) is a financial contract between a buyer and seller that gives the owner the right to buy the underlying security (generally stock) at a certain strike price within a specific time frame. 

The buyer of a call will profit when the underlying market increases in value. Since there is no cap on the price of most assets, the seller of a single call option has infinite risk.

Put Option

Long Put Chart

Put options are the opposite of call options. Whereas a call option is a financial contract that gives the holder the right to buy a security at a particular strike price on or before the expiration date, a put option gives the holder the right to sell the security (generally stock) under the same circumstances. 

Put options increase in value when the underlying market decreases. An investment in a long put option thus acts as an insurance product if held with long stock.

Option Premium

Like stock, an option’s premium represents its current market value. However, unlike stock, options are quoted on a per-share basis. Since one options contract represents the right to purchase 100 shares of the underlying stock/index, the true cost of a call option or a put option trading at $1 would be $100. Factors such as strike price, intrinsic value, time value, and volatility all go into determining the price of options premiums.

Strike Price (Exercise Price)

In options markets, a strike price is a set price at which a put or call can be exercised. This exercise results in one party buying and the other party selling stock or other financial instruments at this pre-established price. The difference between this strike price and the current market value of the stock price tells us whether or not an option is in the money, out of the money, or at the money.

Expiration Date

Unlike stock, all options will eventually expire. The date this happens is called the expiration date. After this date, all option contracts for this time period are settled. The underlying price of the stock determines whether or not the option contract is in the money. If an option’s strike price is in the money at expiration, it will be exercised and assigned. If an options strike price is out of the money at expiration, it will expire worthless. 

Moneyness

option moneyness chart calls and puts

In options trading, the term “moneyness” is used to determine the intrinsic value of an option at any given time. An option can either be in the money, out of the money, or at the money. The relationship between the underlying stock price and the option strike price dictates where the option currently is on the money scale.

Out-the-money-Options

  • A call is out of the money if its strike price is above the current market price of the stock 
  • A put is out of the money if its strike price is below the current market of the stock.

In-the-money-Options

  • A call is in the money if its strike price is below the current market price of the stock 
  • A put is in the money if its strike price is above the current market of the stock.

At-the-money-options

  • Both call and put options are considered at the money if the strike price equals the current market value of the stock.

Option Assignment/Exercisement

Option assignment and option exercisement go hand in hand; one can not happen without the other. The owner of a call or put has the right (but not obligation) to exercise their option contract at any time. When this occurs, the short party is obligated to either buy or sell 100 shares of stock at the strike price of the option contract. 

  • For a long call position, the contract is exercised and converted into 100 shares of long stock.
  • In a short call position, the contract is assigned and converted into 100 shares of short stock.
  • For a long put position, the contract is exercised and converted into 100 short shares of stock. 
  • In a short put position, the contract is assigned and converted into 100 long shares of stock. 

There are many circumstances where it makes sense for the owner of an in-the-money option to exercise their right to buy the stock, such as the issuance of a dividend by the stock (options don’t pay dividends). Options can also be exercised arbitrarily. All in the money options at expiration, however, will be automatically exercised. It is important that all short option positions in the money are liquidated by this date unless the investor wishes to either sell or buy the stock.

Option Settlement

Options contracts are settled in either one of two ways: physical settlement or cash settlement.

1. Physical Settlement

The vast majority of trading equity options are settled via physical delivery. This means that upon the exercise/assignment of the put or call contract, a transference of stock occurs at the strike price, typically 100 shares of the underlying stock per option.

2. Cash Settlement

In options markets that are cash-settled, physical delivery of the underlying asset is not required. A simple and automatic transfer of cash settles these types of options. Cash-settled options typically include European-styled indexes such as NDX and SPX, as well as most binary options.

Credit and Debit Spreads (Verticals)

In options trading, credit and debit spreads (vertical spreads) are strategies that involve buying one option and selling a second option. Both options are in the same class (calls or puts) and expiration but differ in terms of strike prices. 

  • A credit spread results when a net credit is received from the buying and selling of these options. The investor will profit when the spread narrows by an amount less than the premium they received.
  • A debit spread results when a net debit is paid from the buying and selling of these options. The investor will profit when the spread widens by an amount greater than the debit paid.  

As opposed to simply buying or selling single call and put options, utilizing credit and debit spreads lowers the overall risk from market movements, as well as reward.

Equity Option

Equity option markets represent the vast majority of tradable options. The underlying asset in these types of options is shares of the underlying stock. If /when the owner of a long call or put equity option exercises their contract, they will either buy (call) or sell (put) 100 shares of the underlying asset (generally the stock of a specific company) at the strike price specified in the contract. Equity options are settled via physical delivery.

Index Option:

Unlike equity options, you can not purchase the underlying shares of index options as they are not actively traded in the market. Representative indices, such as SPX (S&P 500), dictate the value of these types of contracts. Calls and puts on index options give an investor the right to buy or sell the entire underlying stock index for a defined time period at the specified strike price. Since there is no actively traded stock on indexes, the options are cash-settled. This mitigates assignment risk for the seller.

To better understand the difference between index and equity (ETF) options, read our article, “SPX vs SPY Options: Here’s How They Differ“. If you want to trade volatility, our VIX vs VXX Guide may be more fitting. 

ETF Options

ETF (exchange-traded fund) options are financial securities that possess characteristics of both index and equity options. Like equity options, they are settled in stock (American style); like index options, they represent an underlying composite or basket of stocks. ETF options often allow market participants greater liquidity and diversification than single stocks.

Comparing Option Types

Index vs etf vs equity options

Ex-Dividend date

The ex-dividend date is the day at which the stock of a company begins trading without the value of the issued dividend. To receive this dividend, an investor must own the stock by the market close on the day before it goes ex-dividend.

To capture this dividend, owners of in-the-money call options will most likely exercise their contract. The writers of these calls will therefore be assigned and forced to sell shares at the specified strike price. It is important for call writers to be aware of this date so they are able to trade out of their position to avoid assignment. The seller risks losing large sums of money if they are not aware of this date.

Pin Risk

Pin risk in options trading occurs when the price of the underlying security nears that of the option strike price on the contract’s expiration date. If the contract closes in the money after it expires, investors are unable to trade out of the option. At this point, the long option will be exercised and the short option will be assigned stock. It is therefore wise for investors to close any call or put positions close to being in the money while the market is still open unless they want to hold the shares.

Intrinsic and Extrinsic Value

The value of all option contracts can be calculated by summing up their extrinsic and intrinsic value. Intrinsic value represents what the option would be worth if there was no time remaining. At the moment of expiration, the price of a put or call option must therefore represent all intrinsic value. 

Extrinsic value represents all of the remaining premium, which is determined by time remaining and volatility. A call or put option expiring in three months would therefore have a higher extrinsic value than an option of the same series expiring next month.

Since all option prices are derived from one or both of these values, knowing one value along with the current options market price will tell us the other. For example, if a call option is trading at $3 and has an intrinsic value of $2, the difference must represent an extrinsic value of $1.

Time Value

An option’s extrinsic value is determined by both its time value (theta) and volatility. The time value portion of this equation refers to the amount of time remaining until the expiration of the call or put option. 

Historical Volatility

In options trading, historical volatility is a metric that uses the past performance of an underlying stock to calculate the price premiums of call and put options.

Implied Volatility

Implied volatility is a directionless and forward-looking pricing metric used in options trading. This kind of volatility accounts for the impact of future uncertainties, such as earnings, on the price of a call or put. Supply and demand are major components for determining implied volatility.

LEAPS

LEAP Option Chart

Long-term Equity Anticipation Securities (LEAPS) are extended options that track the price of underlying stocks or indices. Options with expiration dates greater than one year out fall into this category. LEAPS trade just like all other options of their class, with the exception of this prolonged expiration date. Investors sometimes use LEAP put options as a long-term insurance policy against their stock.

Margin Requirement

Compared to stock trading, determining margin requirements for options can be a complex process. The amount of cash/securities required in an account to place certain options trades will depend upon the broker you use. 

This generally concerns the seller of options, where the risk can far surpass the amount of credit received (unlike long option buyers, whose risk is the debit paid). A long call option bought in the market for $3 has an infinite reward, yet a limited risk of $3, which is the premium paid. 

The seller of this option will have the opposite: a limited reward of their $3 credit received and unlimited risk to the upside. Determining the amount necessary to hold this short position is the position’s margin requirement. These calculations will vary from broker to broker. 

Option Roll

An options roll is a strategy that involves making an adjustment in a position’s strike and/or expiration date. Rolling options can help realign calls and puts to be better positioned relative to the underlying security. There are many reasons why options are rolled, two of which are to avoid early assignment and/or extend the duration of a trade so a loss is not realized.

Time Decay

Time decay (also called “theta”) measures the rate at which an option loses its value in response to the passage of time. Unlike stock, all put and call options have an expiration date. As that date nears, the price premium on an option contract decreases in value. After an option expires, there is zero time premium remaining. “Theta” is one of the option “Greeks“.
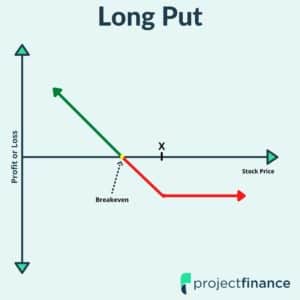
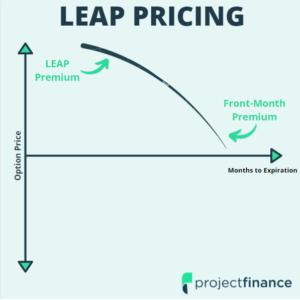
Next Lesson